Fig. 14
Download original image
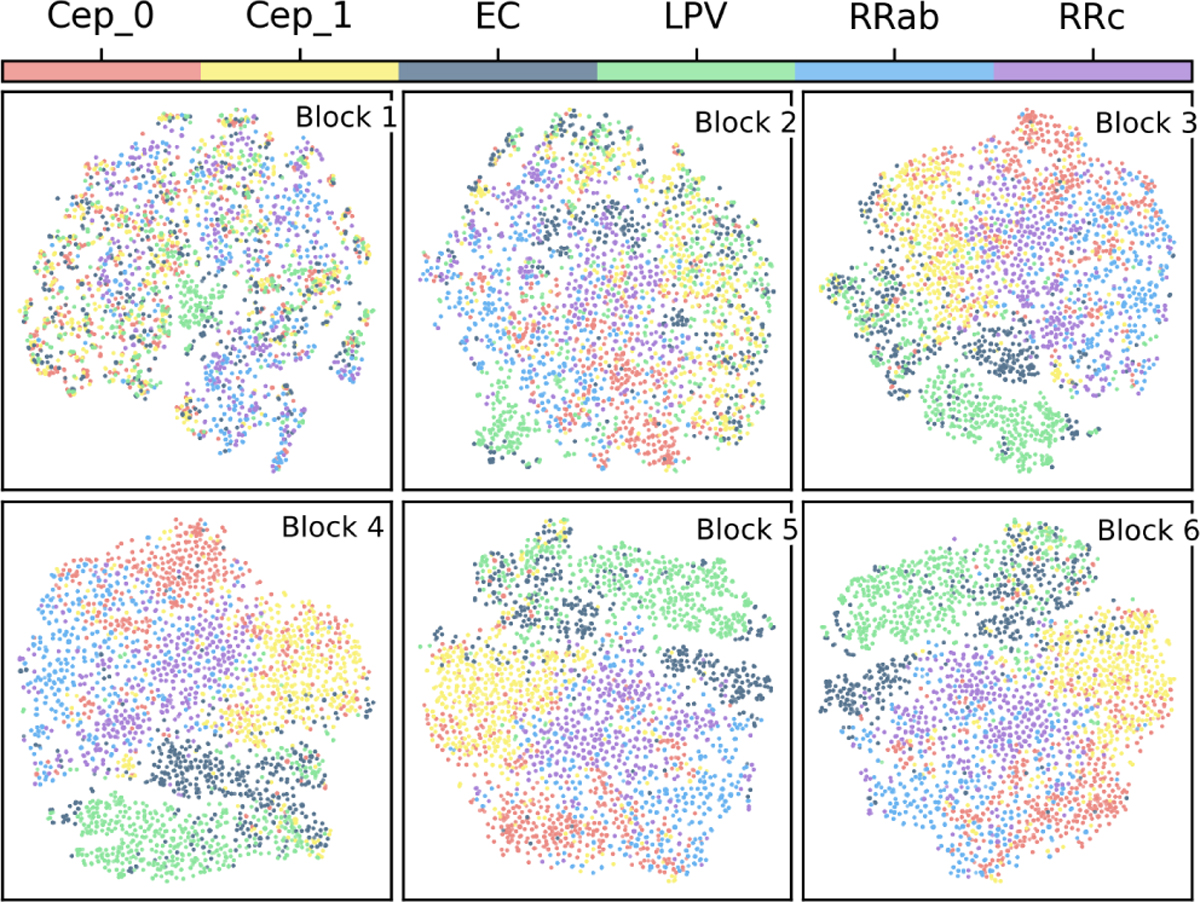
t-SNE visualization of embeddings from each of the six encoder blocks for the Alcock (MACHO Labeled) test set. Each point is a light curve, colored by its true class. The plots show that class structure emerges and improves in the intermediate and deeper layers, even though the model was pretrained without any label information.
Current usage metrics show cumulative count of Article Views (full-text article views including HTML views, PDF and ePub downloads, according to the available data) and Abstracts Views on Vision4Press platform.
Data correspond to usage on the plateform after 2015. The current usage metrics is available 48-96 hours after online publication and is updated daily on week days.
Initial download of the metrics may take a while.