Fig. A.1
Download original image
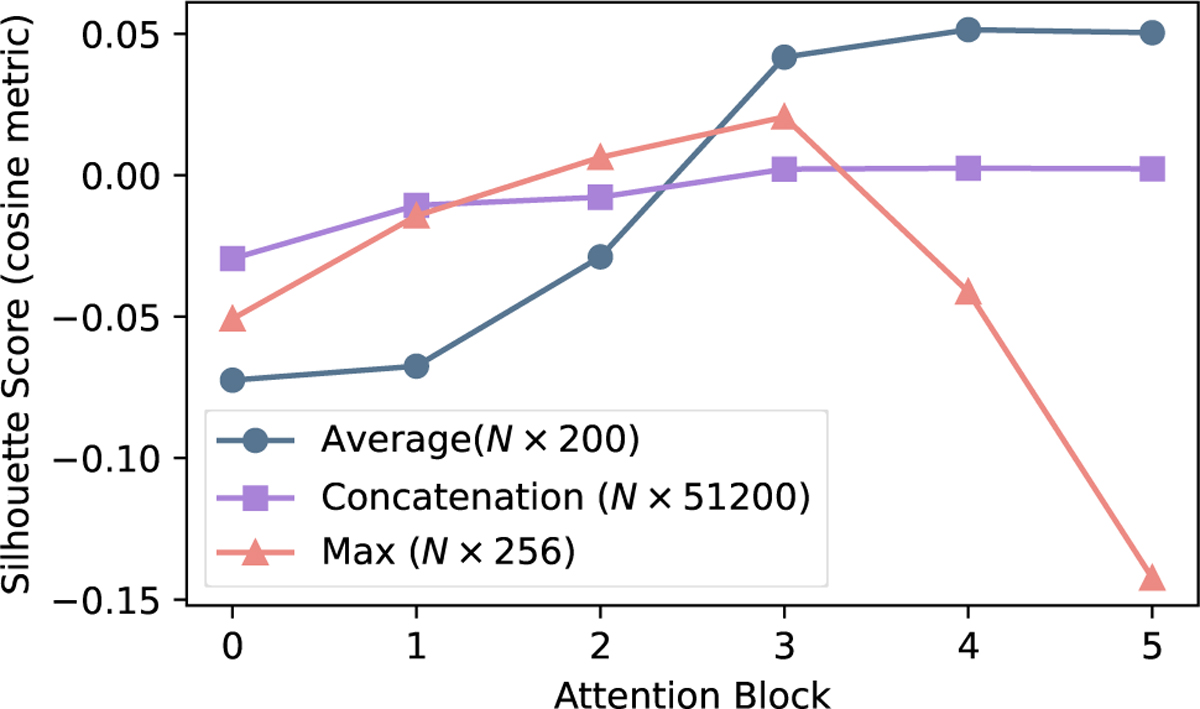
Silhouette score, calculated with a cosine metric, as a function of the attention block number for three embedding aggregation methods. The methods compared are averaging (blue circles), concatenation (purple squares), and max pooling (red triangles). The averaging method consistently achieves the highest score in the final layers, indicating it is the most suitable strategy for producing coherent visualizations of class clusters.
Current usage metrics show cumulative count of Article Views (full-text article views including HTML views, PDF and ePub downloads, according to the available data) and Abstracts Views on Vision4Press platform.
Data correspond to usage on the plateform after 2015. The current usage metrics is available 48-96 hours after online publication and is updated daily on week days.
Initial download of the metrics may take a while.