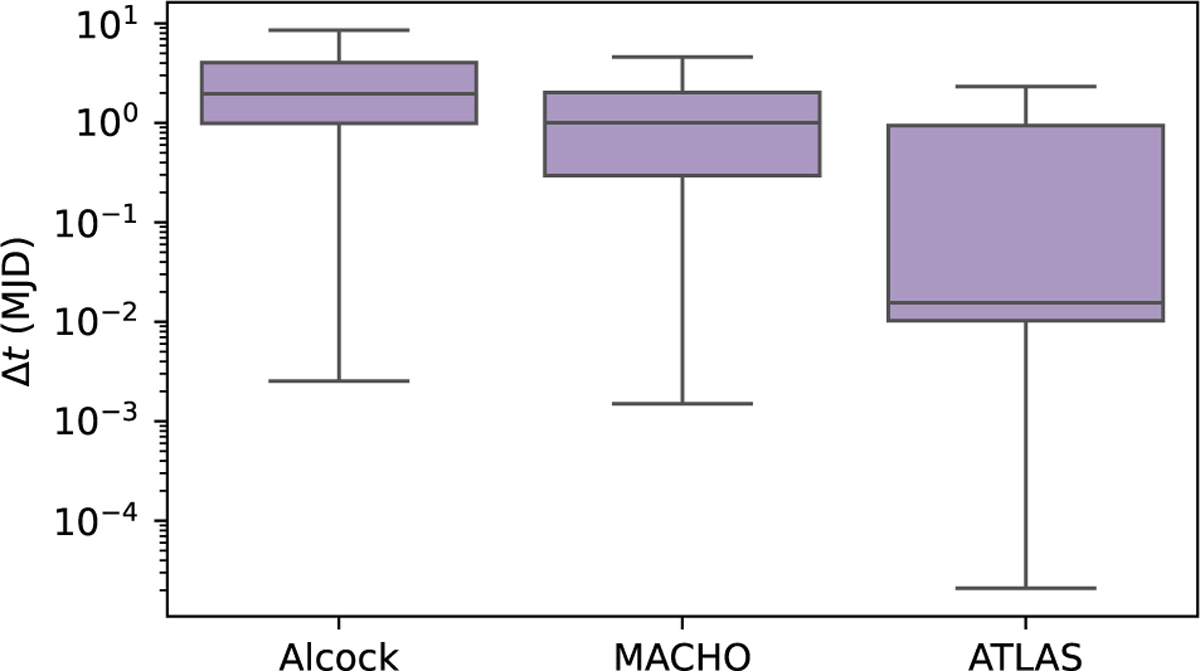
Fig. 5
Download original image
Observation cadence (Δt, time between consecutive points) for the MACHO, Alcock, and ATLAS datasets. The boxplots show that MACHO and Alcock have similar, regular cadences (median ~3−4 days). The ATLAS dataset is distinct, with a much faster median cadence and greater variability in observation times. The y-axis uses a logarithmic scale to show the wide value range.
Current usage metrics show cumulative count of Article Views (full-text article views including HTML views, PDF and ePub downloads, according to the available data) and Abstracts Views on Vision4Press platform.
Data correspond to usage on the plateform after 2015. The current usage metrics is available 48-96 hours after online publication and is updated daily on week days.
Initial download of the metrics may take a while.