Open Access
Fig. 6
Download original image
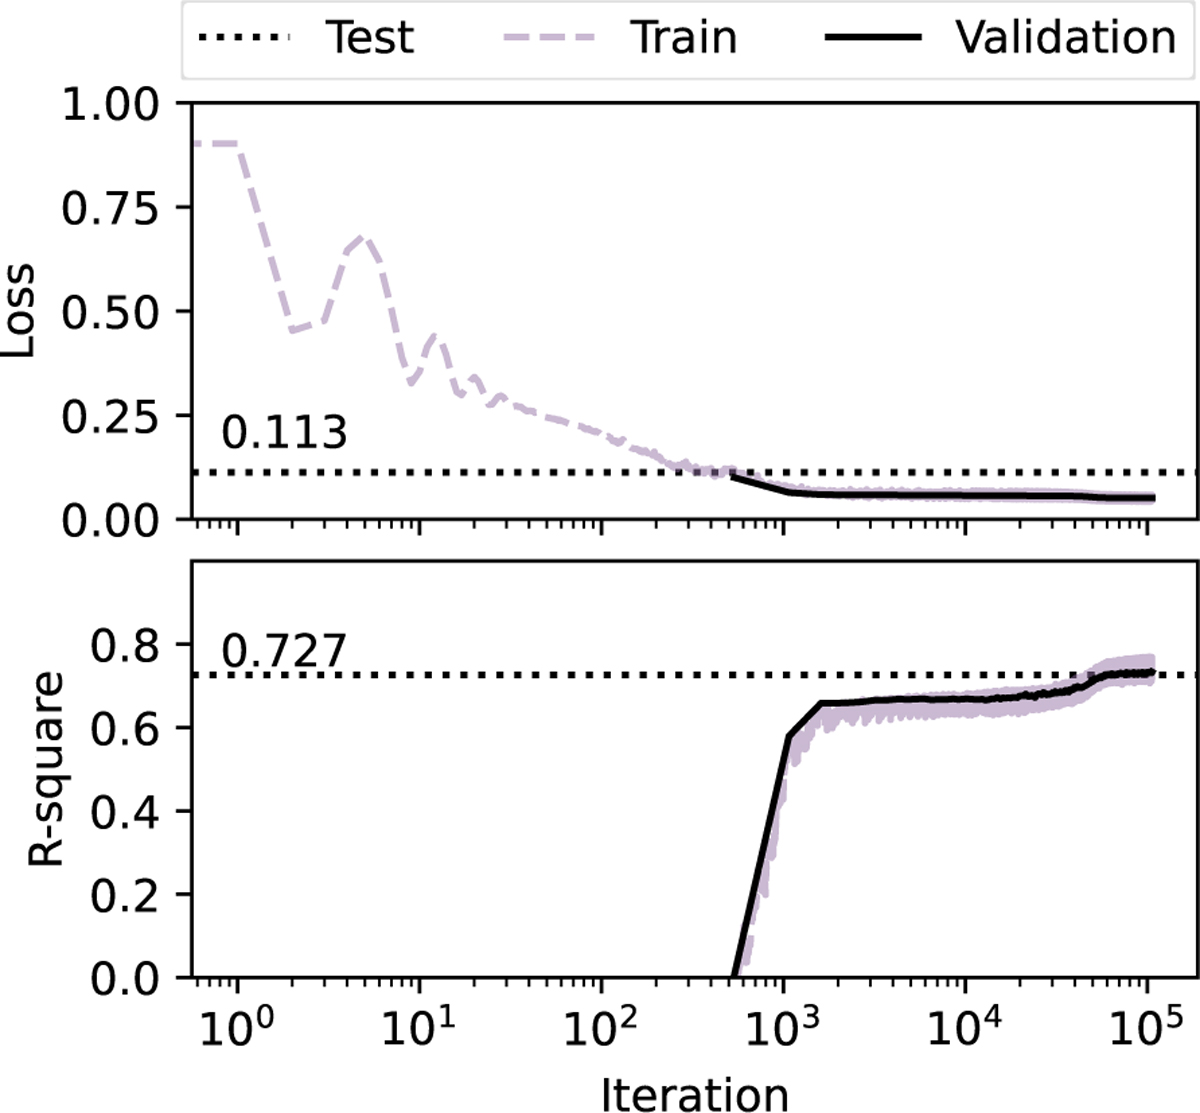
Pretraining learning curves for Astromer 2, showing reconstruction loss (RMSE) versus training epochs. Both training (solid blue) and validation (orange) losses decrease and converge, indicating stable training. The final performance on the held-out test set is marked as a dotted line.
Current usage metrics show cumulative count of Article Views (full-text article views including HTML views, PDF and ePub downloads, according to the available data) and Abstracts Views on Vision4Press platform.
Data correspond to usage on the plateform after 2015. The current usage metrics is available 48-96 hours after online publication and is updated daily on week days.
Initial download of the metrics may take a while.