Fig. 7
Download original image
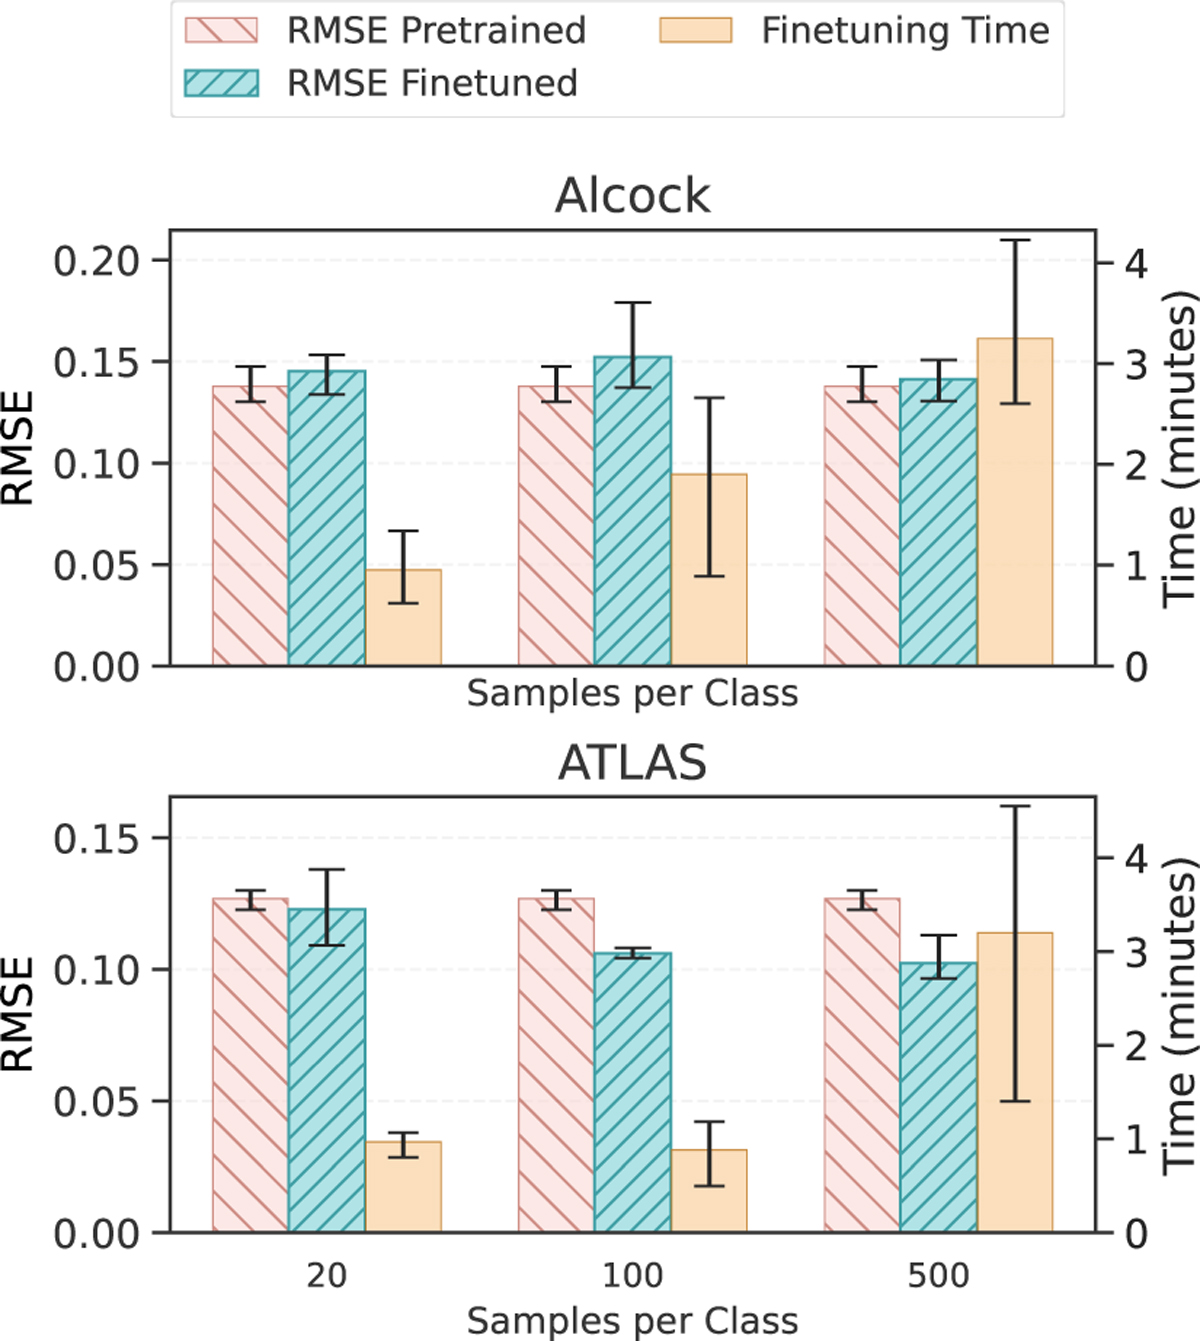
Performance and computational cost comparison on test sets (three-fold cross-validation). The plots display the average performance in terms of RMSE (left y-axis) and training time in minutes (right y-axis) for the Alcock (left) and ATLAS (right) datasets, varying the number of samples per class (SPC). Red bars (pretrained) represent the pretrained model evaluated directly on the test set without fine-tuning. Turquoise bars (finetuned) show performance after fine-tuning with the indicated amount of data. Hatched beige bars indicate the fine-tuning time required. Error bars denote the range (minimum and maximum values) observed across the three folds.
Current usage metrics show cumulative count of Article Views (full-text article views including HTML views, PDF and ePub downloads, according to the available data) and Abstracts Views on Vision4Press platform.
Data correspond to usage on the plateform after 2015. The current usage metrics is available 48-96 hours after online publication and is updated daily on week days.
Initial download of the metrics may take a while.