Fig. 8
Download original image
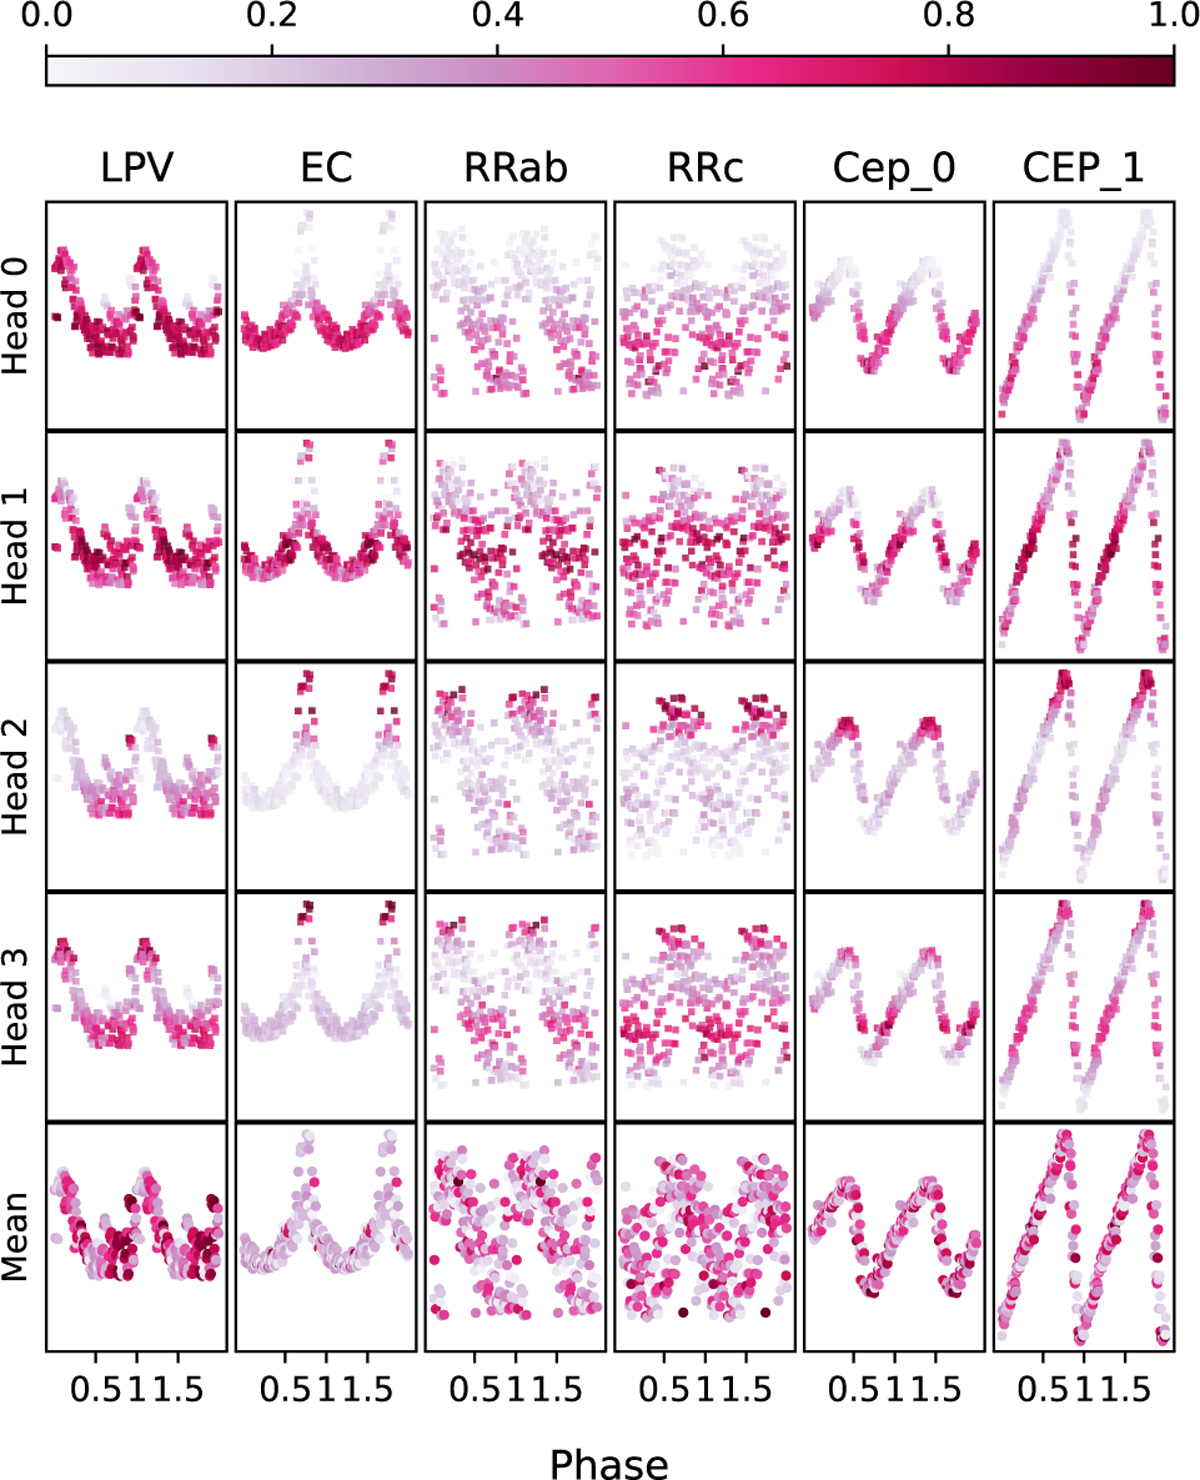
Visualization of attention weights from the first encoder block on sample light curves from the Alcock dataset. Each of the first eight plots shows the average attention from one head (colored bar, top), with the final plot showing the mean across all heads. The light curves are folded by their period for clarity. The model consistently focuses attention on points of maximum and minimum brightness.
Current usage metrics show cumulative count of Article Views (full-text article views including HTML views, PDF and ePub downloads, according to the available data) and Abstracts Views on Vision4Press platform.
Data correspond to usage on the plateform after 2015. The current usage metrics is available 48-96 hours after online publication and is updated daily on week days.
Initial download of the metrics may take a while.