Fig. 1.
Download original image
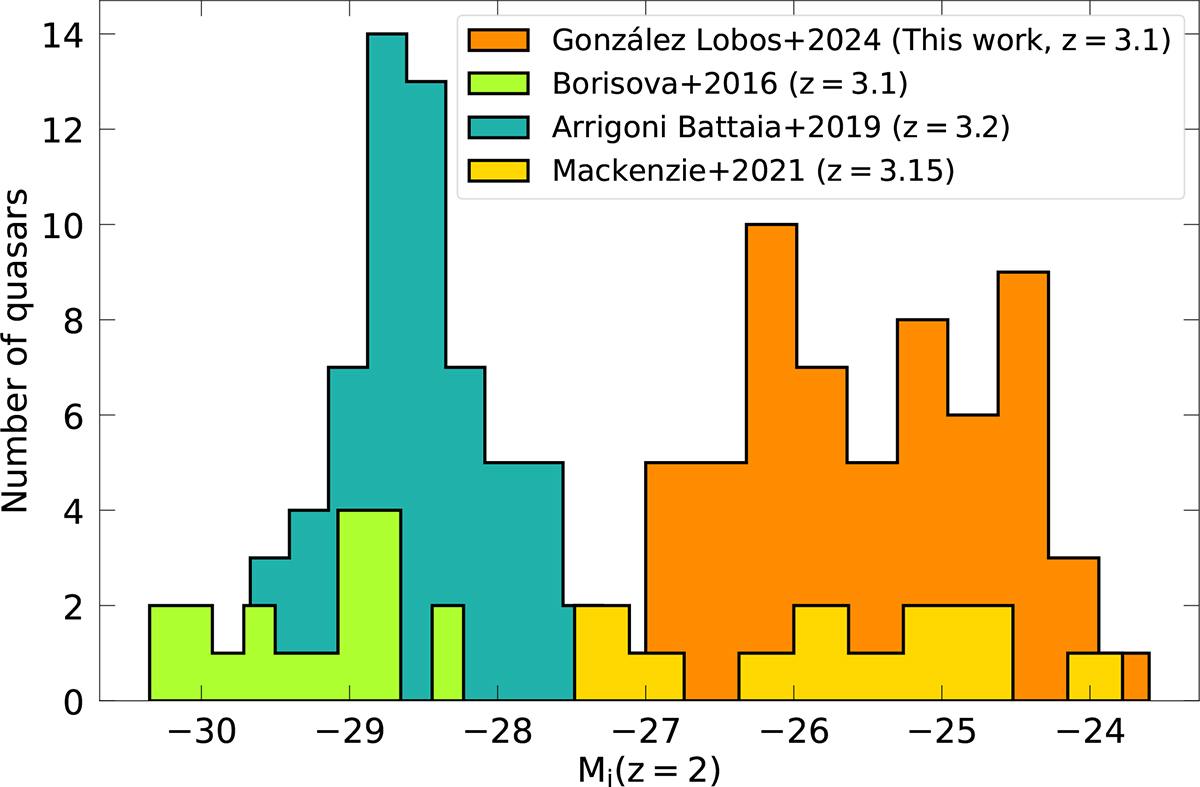
Overview of the z ∼ 3 quasar samples with MUSE observations. The histograms of the absolute i-band magnitude (normalized at z = 2, following Ross et al. 2013) of the QSO MUSEUM III survey: 59 faint quasars from this study (orange), and 61 bright quasars from QSO MUSEUM I (dark green). For comparison, we show the 19 bright quasars from Borisova et al. (2016) (light green) and the 12 faint quasars from Mackenzie et al. (2021) (yellow). The median redshift of each sample is indicated in the legend.
Current usage metrics show cumulative count of Article Views (full-text article views including HTML views, PDF and ePub downloads, according to the available data) and Abstracts Views on Vision4Press platform.
Data correspond to usage on the plateform after 2015. The current usage metrics is available 48-96 hours after online publication and is updated daily on week days.
Initial download of the metrics may take a while.