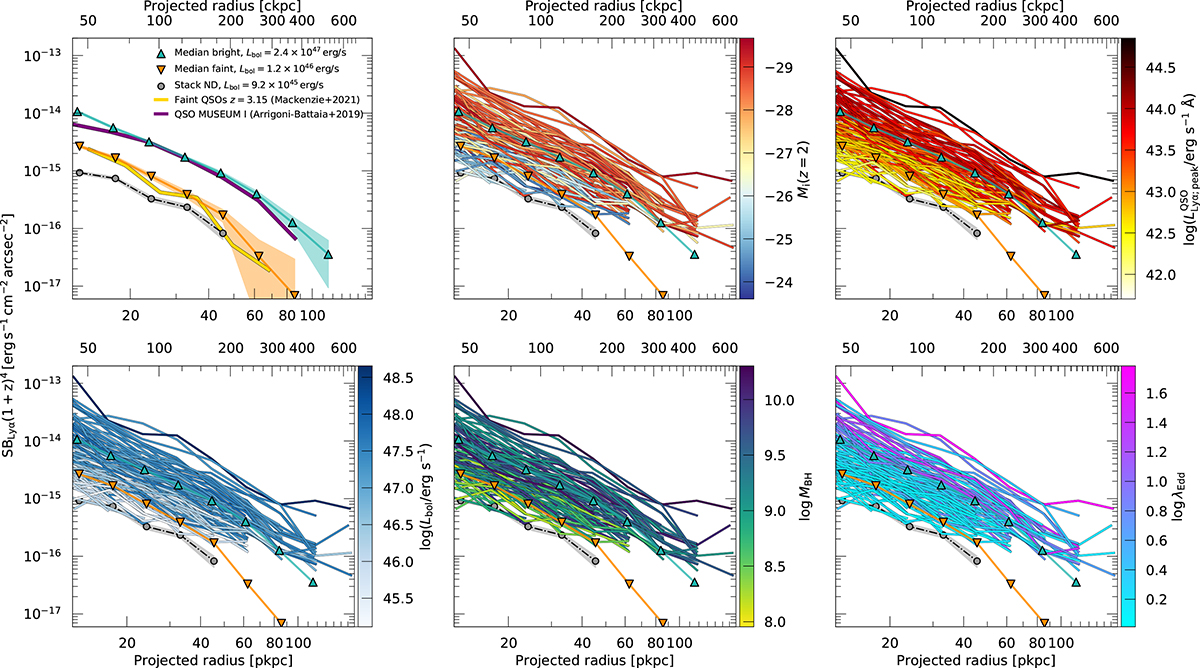
Fig. 10.
Download original image
Lyα SB radial profiles of the QSO MUSEUM III nebulae. The profiles of the detected nebulae are computed by averaging the Lyα SB maps of Figures 5 and C.1 inside annuli with logarithmically increasing radius centered at the quasar location, after masking the 1″ × 1″ normalization region. We cut the profiles when they reach values below the 2σ SB limit within the corresponding radial bin, and only plot profiles that have at least two data-points satisfying this criteria (108/110 profiles). The Lyα SB corrected by cosmological dimming is shown as a function of physical (bottom axis) and comoving (top axis) projected distances. Top left: Median profiles of the faint and bright sample (orange and green triangles) and stacked nondetections (gray). Additionally, the median profiles from Mackenzie et al. (2021) and Arrigoni Battaia et al. (2019a) are shown with a yellow and purple line, respectively. Top middle: Color-coded profiles according to the quasar absolute i-band magnitude normalized to z = 2. Top right: Color-coded profiles according to the peak of the Lyα luminosity density of the quasar. Bottom left: Color-coded profiles according to the bolometric luminosity of the quasar, computed from the monochromatic luminosity at 1350 Å (Appendix B). Bottom middle: Color-coded profiles according to their quasar black hole mass (Appendix B). Bottom right: Color-coded profiles according to their quasar Eddington ratio (Appendix B).
Current usage metrics show cumulative count of Article Views (full-text article views including HTML views, PDF and ePub downloads, according to the available data) and Abstracts Views on Vision4Press platform.
Data correspond to usage on the plateform after 2015. The current usage metrics is available 48-96 hours after online publication and is updated daily on week days.
Initial download of the metrics may take a while.