Fig. 11.
Download original image
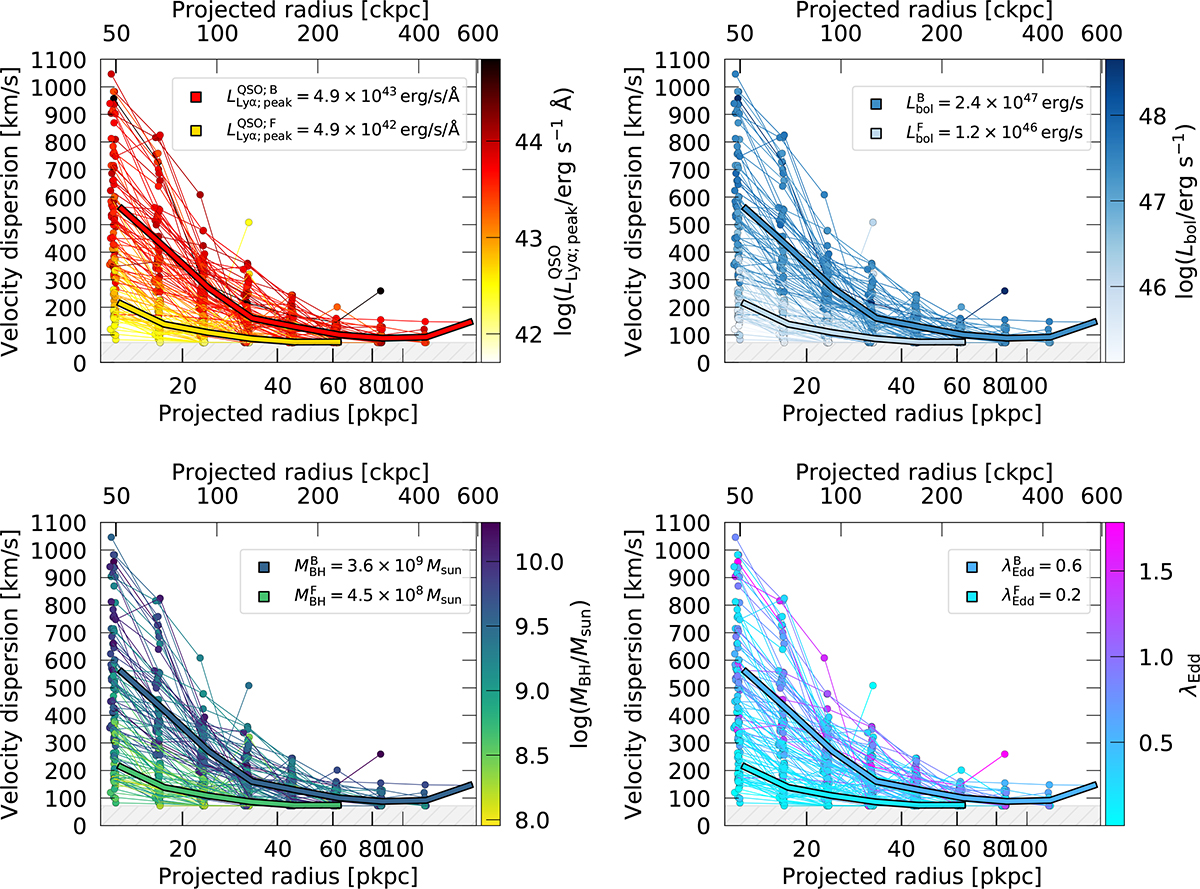
Individual radial profiles of the Lyα velocity dispersion of the QSO MUSEUM III nebulae. Each profile is computed by averaging the Lyα velocity dispersion maps from Figures 8 and C.6 inside the S/N > 3 mask, using the same annuli as the profiles from Figure 10. Top left: The profiles are color-coded by the peak Lyα luminosity density of the quasar. Top right: The profiles are color-coded by the bolometric luminosity of the quasar. Bottom left: The profiles are color-coded by the black hole mass of the quasar. Bottom right: The profiles are color-coded by the Eddington ratio of the quasar. Additionally, we show in each panel the median velocity dispersion profile of the faint and bright samples, color-coded by each property with the median value of each bin indicated at the top right corner of the panel. In each panel, values below the MUSE spectral resolution limit (σ = 72 km s−1) are shown with a dashed gray area.
Current usage metrics show cumulative count of Article Views (full-text article views including HTML views, PDF and ePub downloads, according to the available data) and Abstracts Views on Vision4Press platform.
Data correspond to usage on the plateform after 2015. The current usage metrics is available 48-96 hours after online publication and is updated daily on week days.
Initial download of the metrics may take a while.