Fig. 12.
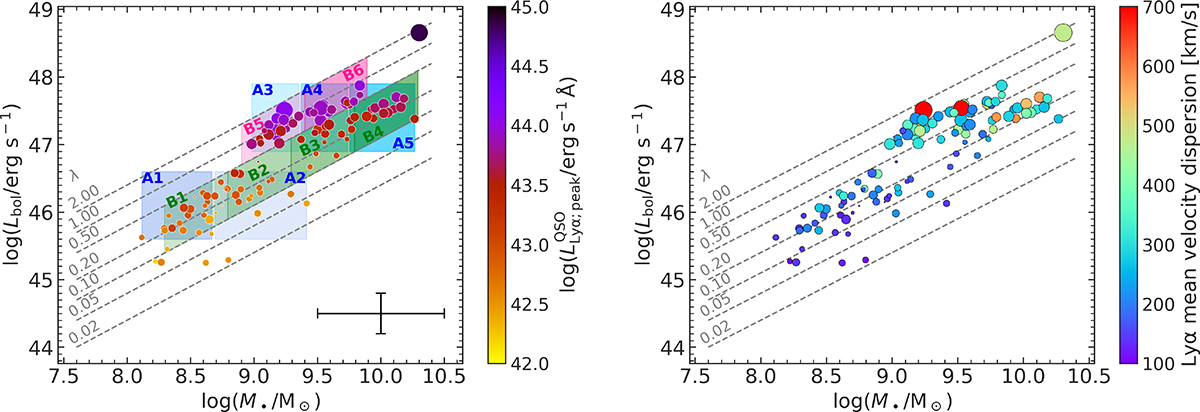
Download original image
Comparison of observed quasar properties with the nebulae properties. We show for each detected nebulae, their quasar bolometric luminosity as a function of black hole mass. The size of each point is proportional to the integrated Lyα luminosity of the nebula divided by the total nebula area in kpc2, with larger symbols having larger ratios. Different values of constant Eddington ratios (λEdd) are shown with dashed gray lines. Left: The points are color-coded by the peak Lyα luminosity density of each quasar (Table C.1). The black error bars in the lower right corner indicate the intrinsic uncertainty of the MBH and Lbol estimators (see Section 2.2). Right: The points are color-coded by the mean velocity dispersion shown in the maps of Figures 8 and C.6. Additionally, we overlay in the left panel the bins covering different quasar properties described in Section 4.1.
Current usage metrics show cumulative count of Article Views (full-text article views including HTML views, PDF and ePub downloads, according to the available data) and Abstracts Views on Vision4Press platform.
Data correspond to usage on the plateform after 2015. The current usage metrics is available 48-96 hours after online publication and is updated daily on week days.
Initial download of the metrics may take a while.