Fig. 13.
Download original image
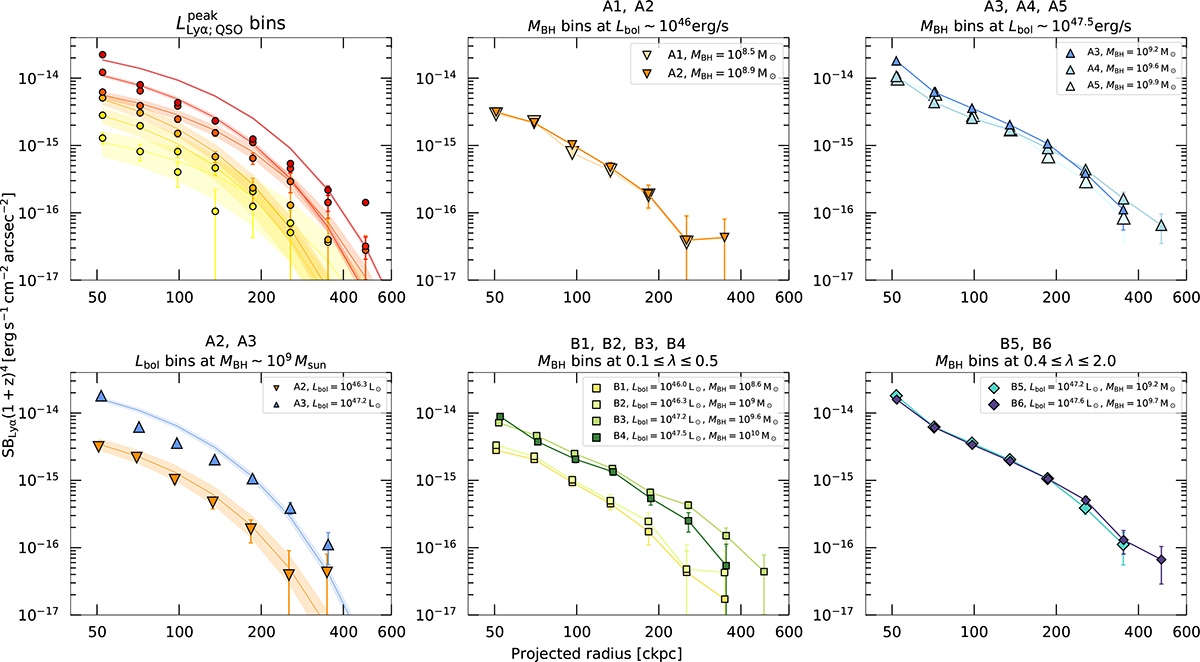
Median radial profiles of the Lyα SB for bins of different quasar properties. The panels show the median Lyα SB corrected by cosmological dimming as a function of projected comoving distances within different bins, the error bars represent the mean 1σ uncertainty of the stacked data points. Top left: Median profiles within equally spaced bins of peak Lyα luminosity density of the quasars (see Section 4.1), color-coded by the median ![]() of the bin (same color as used for the individual radial profiles as Figure 10). The exponential fits (see Section 4.1.2) of the profiles are shown by the associated shaded areas. Top middle: Median profiles within bins A1 and A2 of Figure 12. Top right: Median profiles within bins A3, A4 and A5. Bottom left: Median profiles within bins A2 and A3. Bottom middle: Median profiles within bins B1, B2, B3 and B4. Bottom right: Median profiles within bins B5 and B6. The median bolometric luminosity and black hole mass of bins A1-5 and B1-6 are indicated in the legend of each panel. Additionally, we show in the leftmost column the resulting fits to an exponential function of the form SBLyα(1 + z)4 = SB0 × e(r/Rh) to the median profiles with a solid curve and shaded regions indicating their 1σ uncertainties (see text for details), using the same colors as the data points.
of the bin (same color as used for the individual radial profiles as Figure 10). The exponential fits (see Section 4.1.2) of the profiles are shown by the associated shaded areas. Top middle: Median profiles within bins A1 and A2 of Figure 12. Top right: Median profiles within bins A3, A4 and A5. Bottom left: Median profiles within bins A2 and A3. Bottom middle: Median profiles within bins B1, B2, B3 and B4. Bottom right: Median profiles within bins B5 and B6. The median bolometric luminosity and black hole mass of bins A1-5 and B1-6 are indicated in the legend of each panel. Additionally, we show in the leftmost column the resulting fits to an exponential function of the form SBLyα(1 + z)4 = SB0 × e(r/Rh) to the median profiles with a solid curve and shaded regions indicating their 1σ uncertainties (see text for details), using the same colors as the data points.
Current usage metrics show cumulative count of Article Views (full-text article views including HTML views, PDF and ePub downloads, according to the available data) and Abstracts Views on Vision4Press platform.
Data correspond to usage on the plateform after 2015. The current usage metrics is available 48-96 hours after online publication and is updated daily on week days.
Initial download of the metrics may take a while.