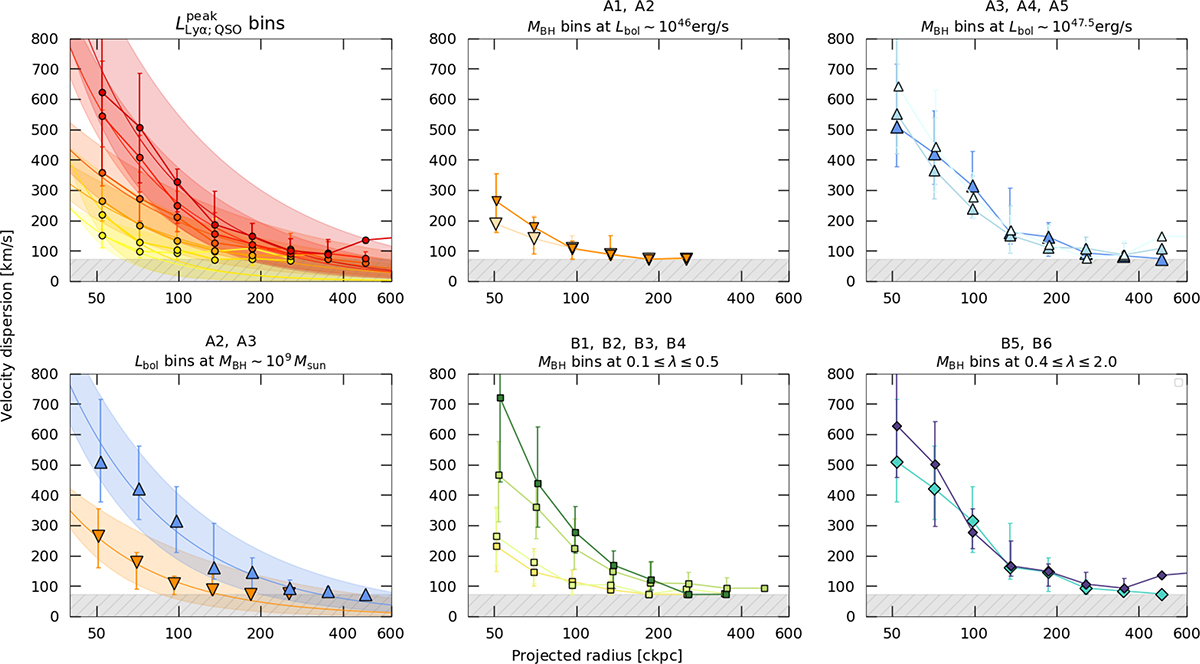
Fig. 14.
Download original image
Median radial profiles of the Lyα velocity dispersion for bins of different quasar properties. The panels show the median velocity dispersion of the Lyα nebular line as a function of projected comoving distances within the same bins, layout and colors as Figure 13. The error bars represent the uncertainty obtained from the 16 to 84 percentile of the stacked data points. In each panel, the shaded gray regions mark the values below the spectral resolution limit of the observations. Additionally, we show in the leftmost column the resulting power law fits in comoving distance units of the form σ = σ50(r/50 kpc)−β to the median profiles with a solid curve and shaded regions indicating their 1σ uncertainties (see text for details).
Current usage metrics show cumulative count of Article Views (full-text article views including HTML views, PDF and ePub downloads, according to the available data) and Abstracts Views on Vision4Press platform.
Data correspond to usage on the plateform after 2015. The current usage metrics is available 48-96 hours after online publication and is updated daily on week days.
Initial download of the metrics may take a while.