Fig. 15.
Download original image
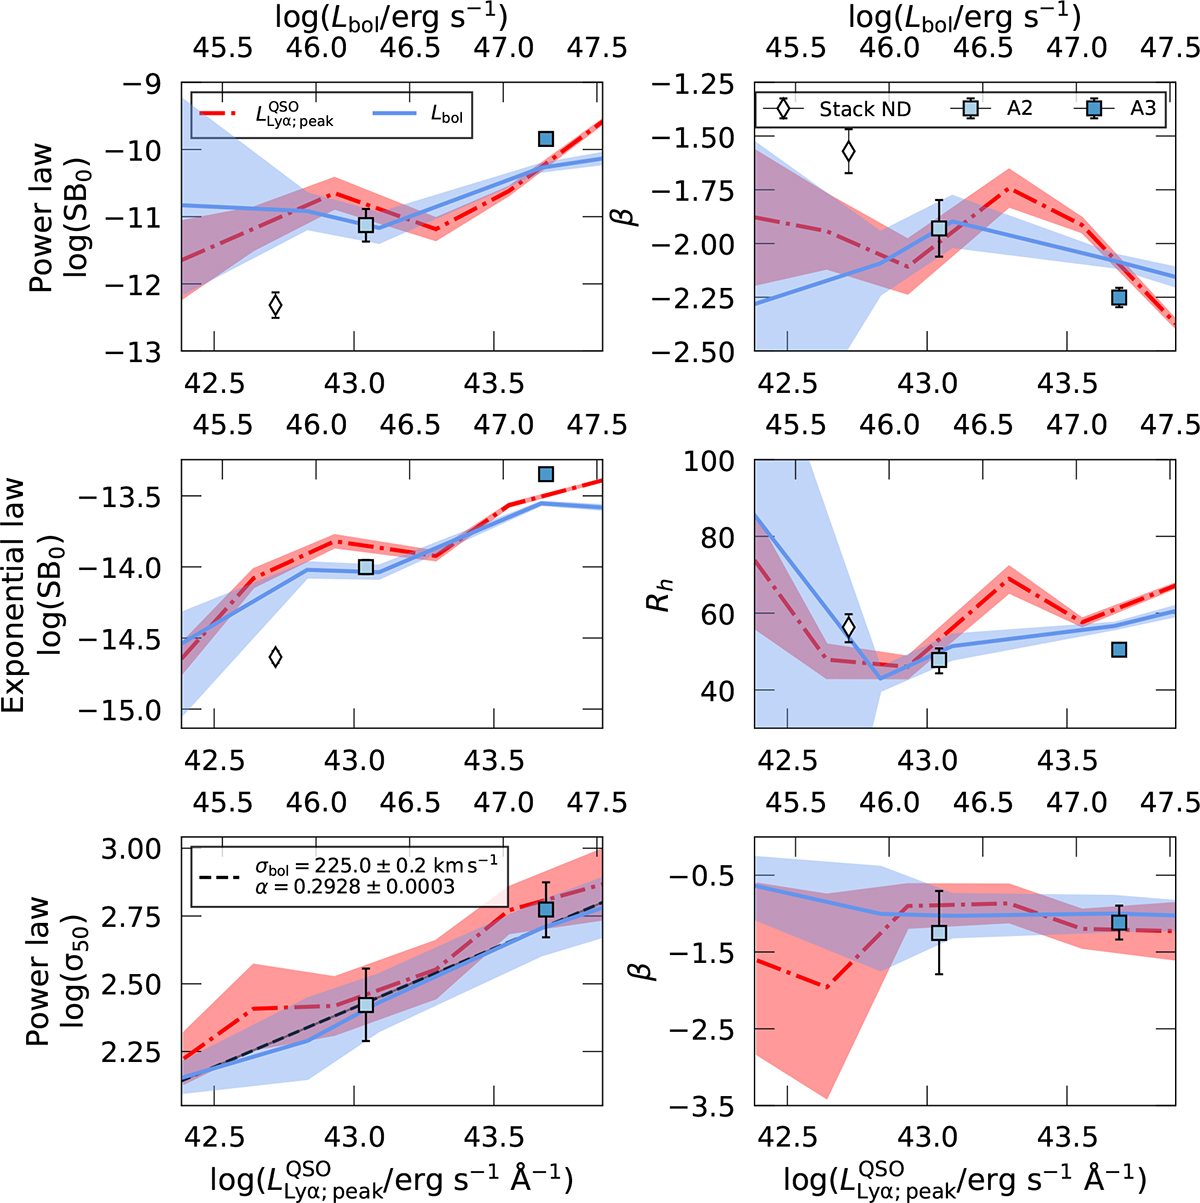
Fit parameters from a power and exponential law to the stacked SB and velocity dispersion profiles as functions of their median quasar luminosities. The first row shows the fitted log(SB0) (left) and β (right) parameters of a power law versus the median peak Lyα luminosity density (top axis, dot-dashed red line) and bolometric luminosity (bottom axis, blue line) of the quasar, with their respective uncertainties as shaded areas. The second row shows the log(SB0) and Rh parameters of an exponential law fit as a function of their median quasar luminosities. The bottom row shows the fitted log(σ50) and β of a power law fit to the median velocity dispersion profiles as a function of their quasar luminosity. We also show in the left panel a power law fit to the normalization factor as a function of bolometric luminosity of the form ![]() and parameters shown in the legend with a dashed black line and 1σ uncertainty shaded area. Finally, the fitted parameters for the profile of the stacked nondetections are shown with a white diamond and error bars representing the 1σ uncertainty, while the fitted parameters of bins A2 ans A3 are shown with light blue and dark blue squares, respectively.
and parameters shown in the legend with a dashed black line and 1σ uncertainty shaded area. Finally, the fitted parameters for the profile of the stacked nondetections are shown with a white diamond and error bars representing the 1σ uncertainty, while the fitted parameters of bins A2 ans A3 are shown with light blue and dark blue squares, respectively.
Current usage metrics show cumulative count of Article Views (full-text article views including HTML views, PDF and ePub downloads, according to the available data) and Abstracts Views on Vision4Press platform.
Data correspond to usage on the plateform after 2015. The current usage metrics is available 48-96 hours after online publication and is updated daily on week days.
Initial download of the metrics may take a while.