Fig. 16.
Download original image
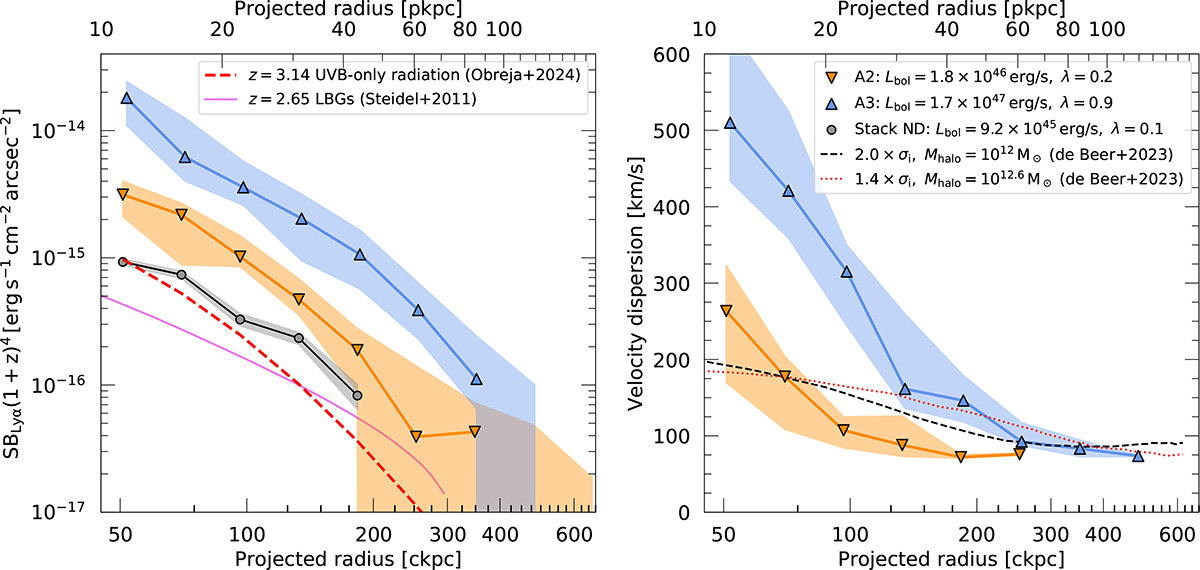
Median Lyα SB and velocity dispersion of the stacked radial profiles. Left: Lyα SB corrected by cosmological dimming as a function of projected comoving distance for the stacked nondetections in gray dots and bins A2 and A3 with orange and blue triangles, respectively. The simulated Lyα profile obtained from the illumination of a 1012.45 M⊙ halo by only the UVB (Obreja et al. 2024) is shown with a dashed red line. The profile around LBGs (Steidel et al. 2011) is shown with a magenta line. Right: Velocity dispersion as a function of projected comoving distances of bins A2 and A3 with orange and blue triangles, respectively, and their shaded region representing the 25th to 75th percentiles. Additionally, we show with a dashed black line and a dot-dashed red line the intrinsic Lyα velocity dispersion (σint) from de Beer et al. (2023) using cosmological simulations of halos at z = 3.017 with Mhalo = 1012 and 1012.6 M⊙, respectively, after rescaling to match the velocity dispersion at 17 kpc of bin A2 (see Section 4.3). The median bolometric luminosity and Eddington ratio for the sources in bins A2 and A3 are indicated in the legend.
Current usage metrics show cumulative count of Article Views (full-text article views including HTML views, PDF and ePub downloads, according to the available data) and Abstracts Views on Vision4Press platform.
Data correspond to usage on the plateform after 2015. The current usage metrics is available 48-96 hours after online publication and is updated daily on week days.
Initial download of the metrics may take a while.