Fig. 17.
Download original image
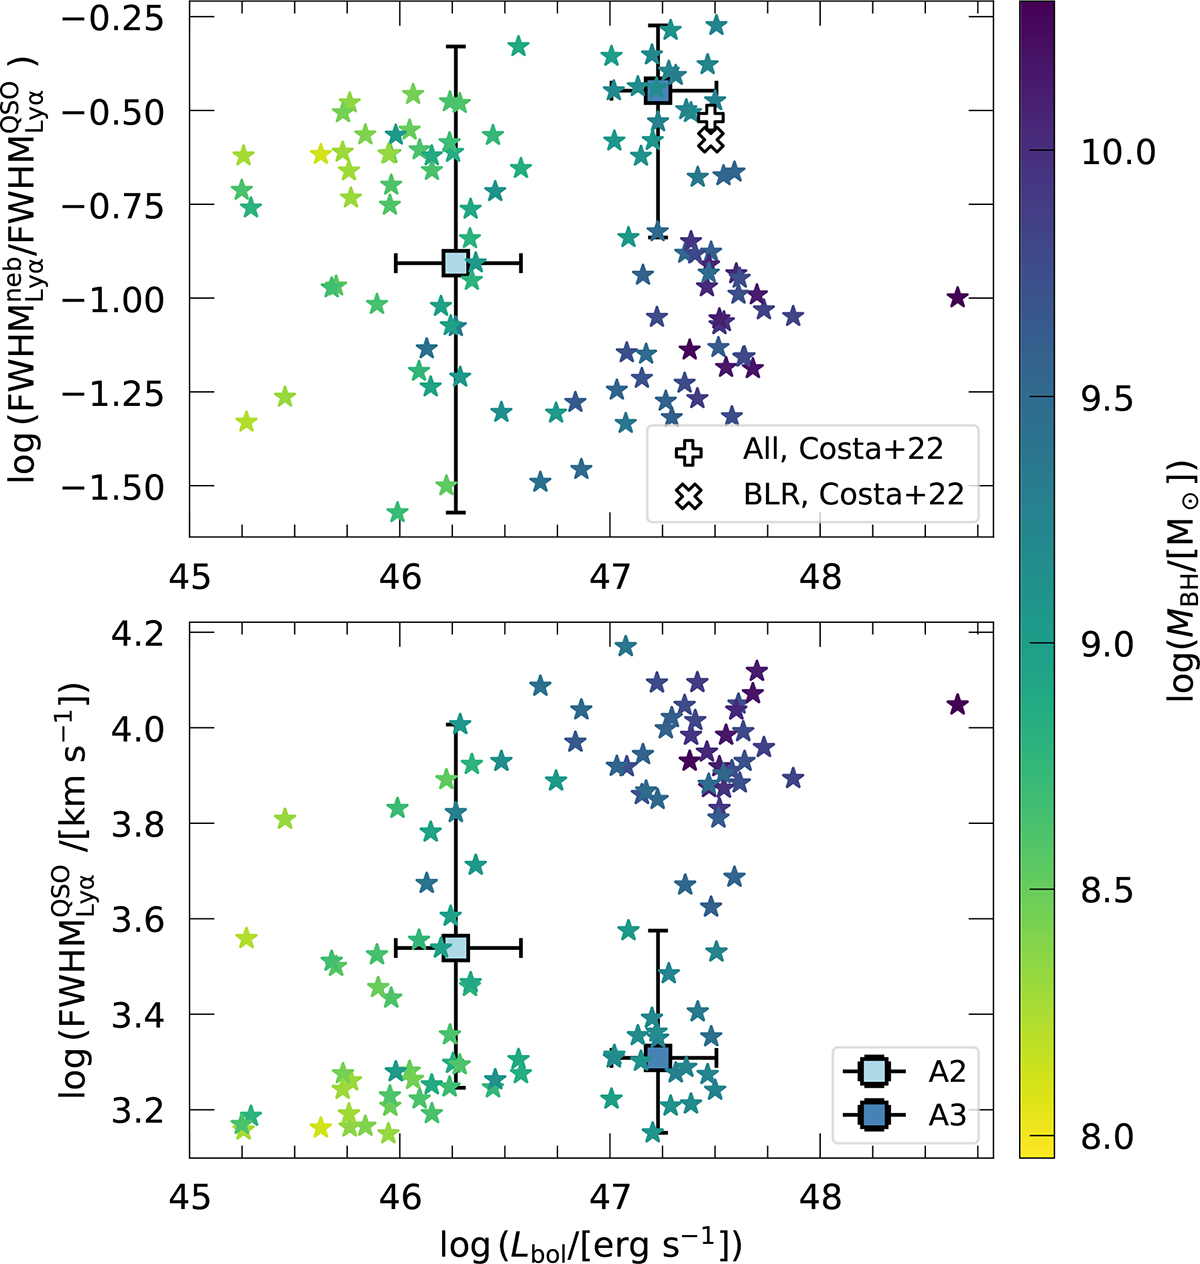
Lyα FWHM vs. bolometric luminosity. In both panels each star represents a system with nebula detected and colors indicating the black hole mass. Additionally, we show in both panels the median values of bins A2 and A3, with their error bars representing the full range of values in the bin. Top: Ratio of the Lyα FWHM of the nebula, computed from the mean velocity dispersion of the second moment maps (Figures 8 and C.6), and the Lyα FWHM of the quasar as a function of bolometric luminosity. Data points obtained from the z ∼ 6 cosmological simulations in Costa et al. (2022) considering all powering mechanisms (white plus) and scattering from the BLR only (white cross). Bottom: FWHM of the Lyα line of the quasar (Tables B.1 and B.2) as a function of the bolometric luminosity of the quasar (see Appendix B).
Current usage metrics show cumulative count of Article Views (full-text article views including HTML views, PDF and ePub downloads, according to the available data) and Abstracts Views on Vision4Press platform.
Data correspond to usage on the plateform after 2015. The current usage metrics is available 48-96 hours after online publication and is updated daily on week days.
Initial download of the metrics may take a while.