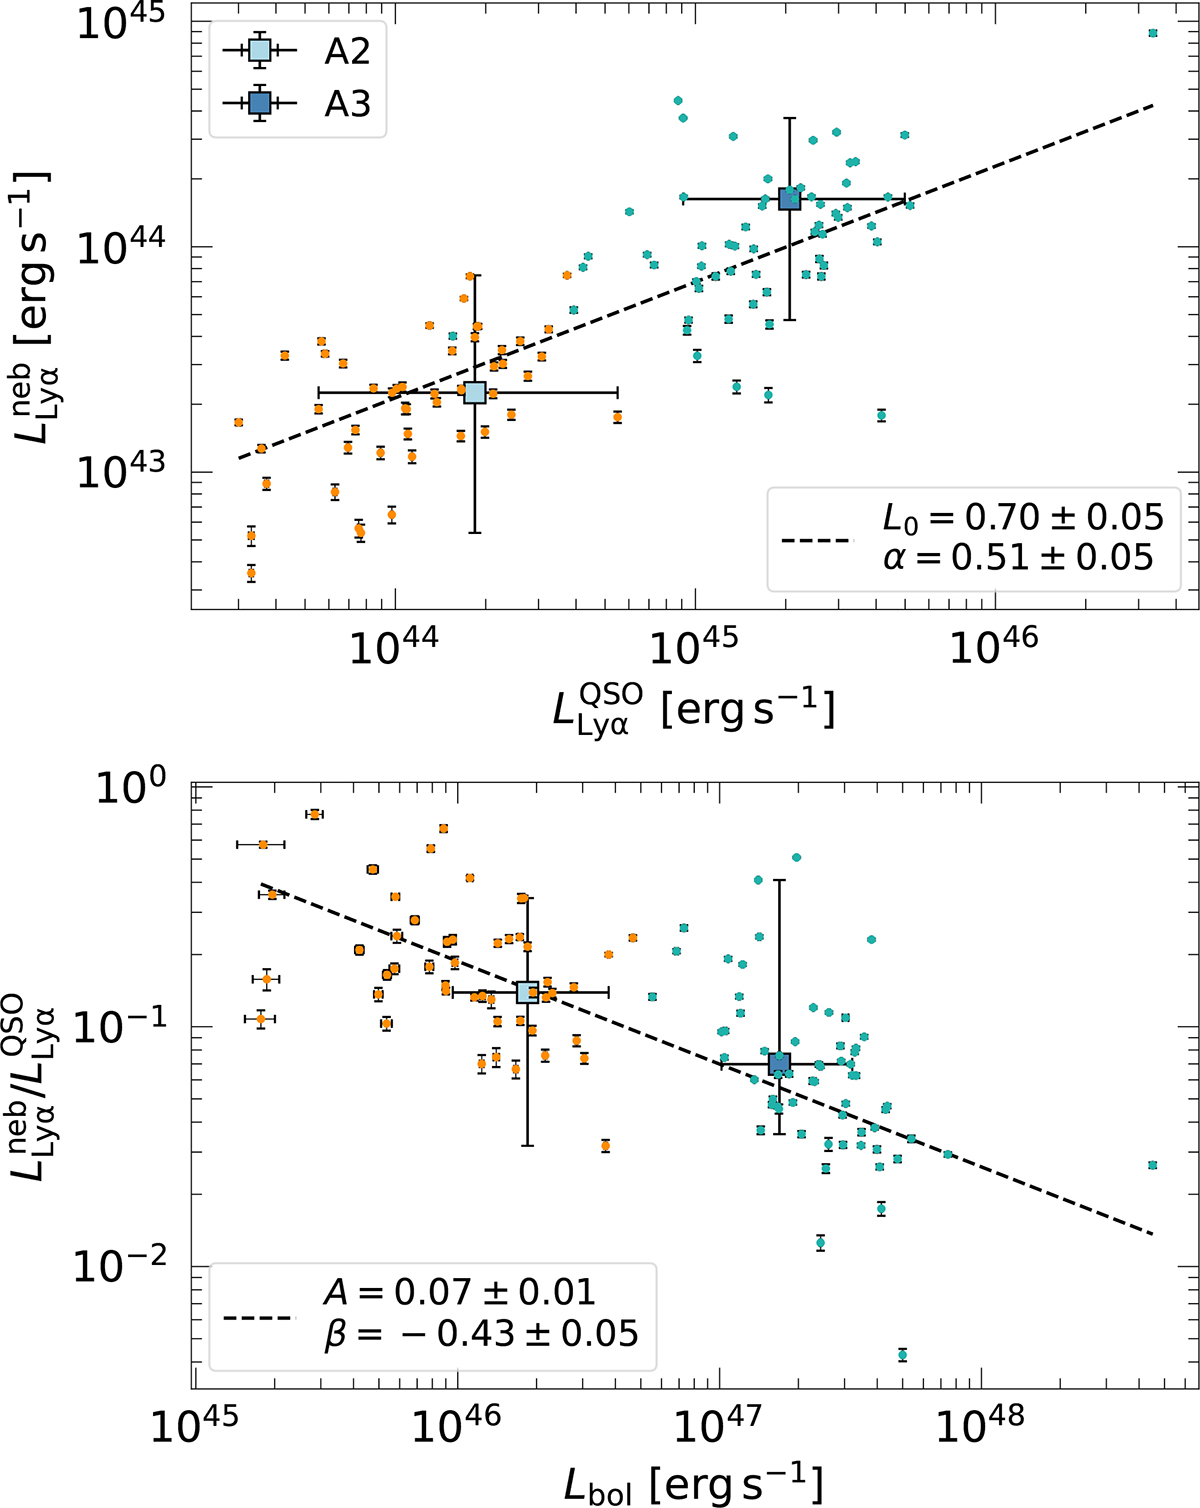
Fig. 18.
Download original image
Comparison of nebular luminosities as a function of quasar luminosities. Top: Lyα luminosity of the detected nebulae versus Lyα luminosity of the quasar, integrated within the ±FWHM range of the nebular Lyα line (see Section 3.3 and Tables A.2 and C.1) and error bars representing the 1σ uncertainty of the measurements. The median luminosities of bins A2 and A3 are shown with blue squares and their error bars represent the full range of values within each bin. Additionally, we plot with a dashed black line a power law fit of the form ![]() and list the fitted parameters in the legend. Bottom: Ratio of Lyα luminosities between the nebula and quasar as a function of the bolometric luminosity of the quasar. Similarly, the median values and full range within bins A2 and A3 are shown with blue squares and error bars, respectively. We also plot with a dashed black line a power law fit of the form
and list the fitted parameters in the legend. Bottom: Ratio of Lyα luminosities between the nebula and quasar as a function of the bolometric luminosity of the quasar. Similarly, the median values and full range within bins A2 and A3 are shown with blue squares and error bars, respectively. We also plot with a dashed black line a power law fit of the form ![]() and show the fitted parameters in the legend.
and show the fitted parameters in the legend.
Current usage metrics show cumulative count of Article Views (full-text article views including HTML views, PDF and ePub downloads, according to the available data) and Abstracts Views on Vision4Press platform.
Data correspond to usage on the plateform after 2015. The current usage metrics is available 48-96 hours after online publication and is updated daily on week days.
Initial download of the metrics may take a while.