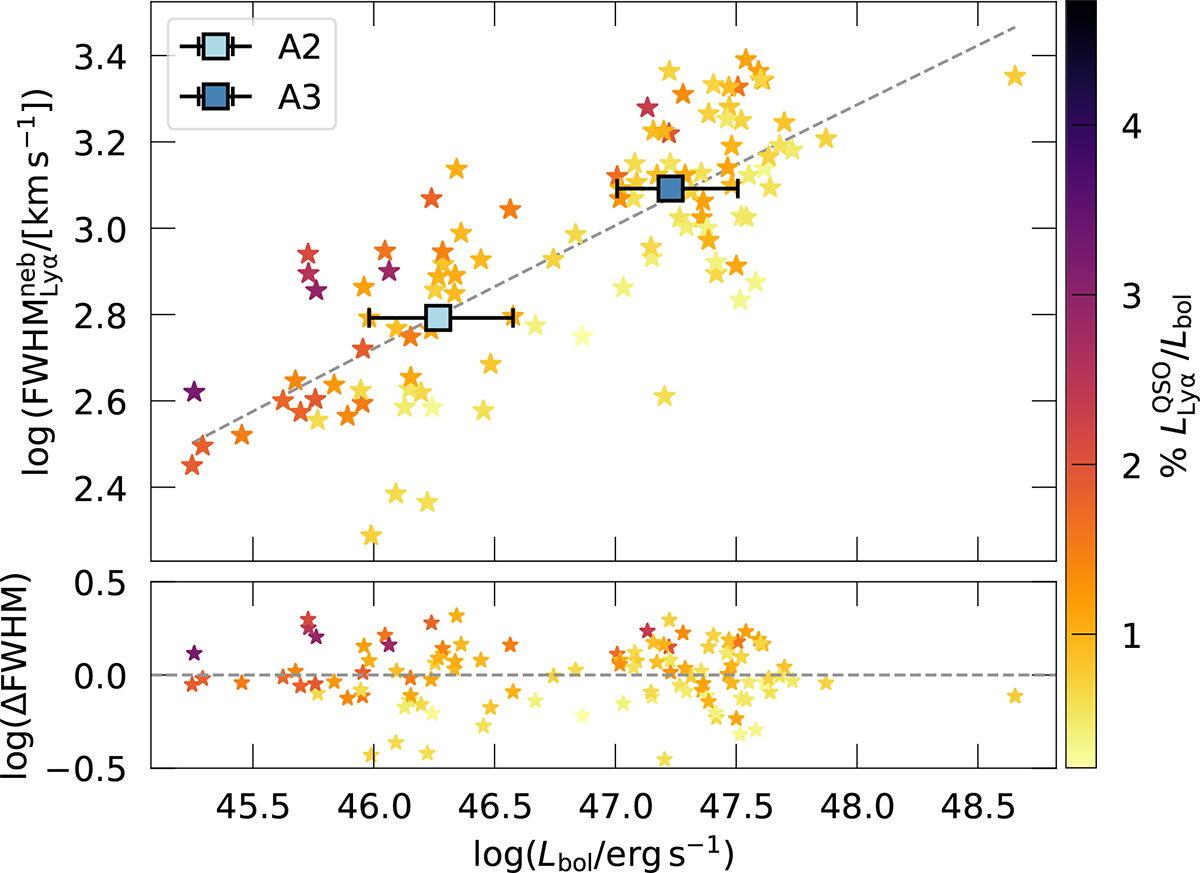
Fig. 19.
Download original image
Lyα FWHM as a function of quasar luminosities. In both panels each star represents a system with nebula detected and colors correspond to the percentage of the quasar Lyα luminosity (integrated within the ±FWHM of the nebula) with respect to the bolometric luminosity. Top: Lyα FWHM at the center of the nebula, computed from the first point in the velocity dispersion radial profiles (Figure 11) as a function of bolometric luminosity of the quasar. The median values of bins A2 and A3 are indicated with blue squares and error-bars indicating the range of Lbol within each bin. The dashed gray line represents a power law fit to the data points. Bottom: Distance from the data points to the power law fit shown in the top panel.
Current usage metrics show cumulative count of Article Views (full-text article views including HTML views, PDF and ePub downloads, according to the available data) and Abstracts Views on Vision4Press platform.
Data correspond to usage on the plateform after 2015. The current usage metrics is available 48-96 hours after online publication and is updated daily on week days.
Initial download of the metrics may take a while.