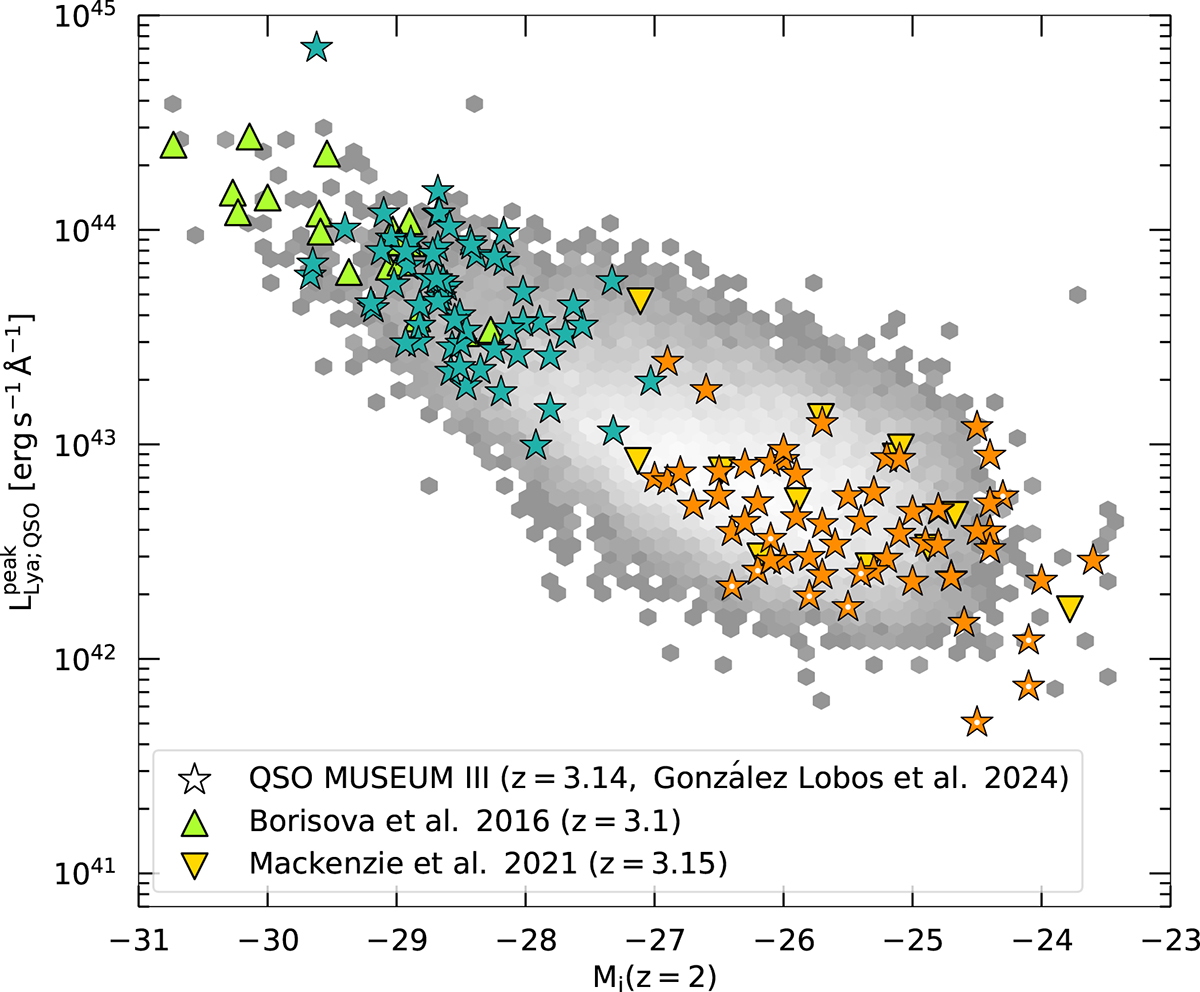
Fig. 2.
Download original image
Overview of the luminosity distribution of the observed z ∼ 3 quasars. The figure shows the quasar peak Lyα luminosity density as a function of absolute i-band magnitude normalized at z = 2 (Mi(z = 2), following Ross et al. 2013). The QSO MUSEUM III faint and bright quasars are shown with orange and dark green stars, respectively. The systems with no Lyα nebula detected are marked with a white dot (see Section 3.1). In addition, we show the location of the 17 brighter quasars targeted in Borisova et al. (2016) (light green triangles) and the 12 fainter objects from Mackenzie et al. (2021) (yellow triangles). The 2D number density of 3.0 < z < 3.46 quasars from SDSS DR17 (25 806 quasars, Abdurro’uf et al. 2022) is shown in logarithmic gray scale, white marking the highest densities. Section 2.2 explains how the luminosities are derived.
Current usage metrics show cumulative count of Article Views (full-text article views including HTML views, PDF and ePub downloads, according to the available data) and Abstracts Views on Vision4Press platform.
Data correspond to usage on the plateform after 2015. The current usage metrics is available 48-96 hours after online publication and is updated daily on week days.
Initial download of the metrics may take a while.