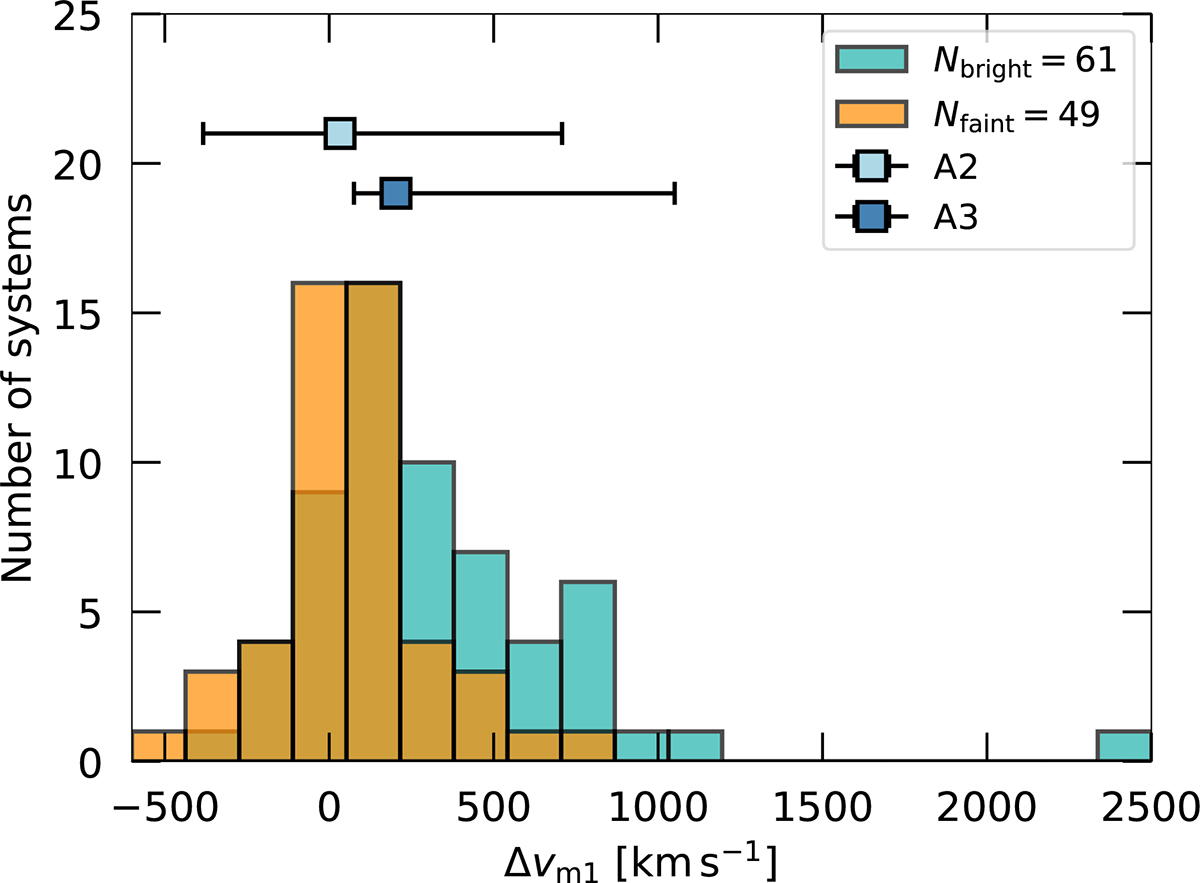
Fig. 20.
Download original image
Distribution of the Lyα nebula velocity shift with respect to the quasar Lyα emission peak. The plot shows histograms of the velocity shifts (vm1) computed from the first moment of the flux distribution (Tables A.2 and C.1) for the extended Lyα emission around the bright (green) and faint (orange) QSO MUSEUM samples. The size of each histogram bin corresponds to 163 km s−1. We also show the median vm1 for bins A2 and A3 (Figure 12) at the respective number of systems. Their error bars indicate the full range of velocity shifts within A2 and A3.
Current usage metrics show cumulative count of Article Views (full-text article views including HTML views, PDF and ePub downloads, according to the available data) and Abstracts Views on Vision4Press platform.
Data correspond to usage on the plateform after 2015. The current usage metrics is available 48-96 hours after online publication and is updated daily on week days.
Initial download of the metrics may take a while.