Fig. B.1.
Download original image
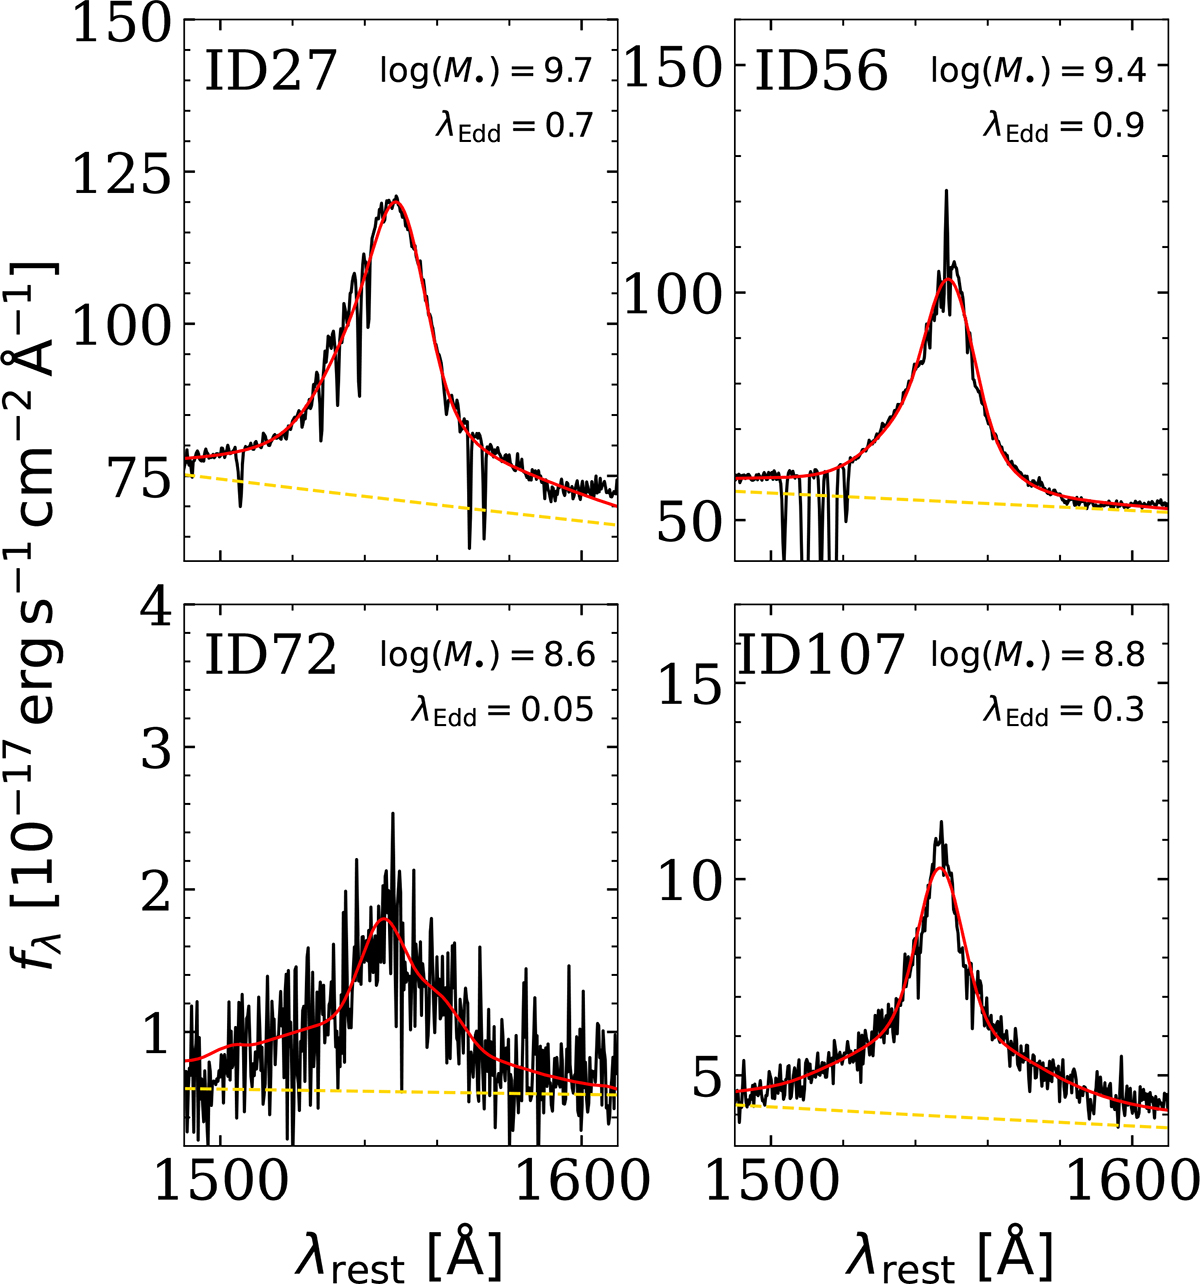
Four examples of C IV and continuum fit using PYQSOFIT. Each panel shows the 1-D spectrum (black) of one targeted quasar (ID in the top-left corner) together with the estimated continuum (dashed yellow line) and the best fit (red). The black hole mass and Eddington ratio obtained from this fit are listed in the top-right corner (see text for details).
Current usage metrics show cumulative count of Article Views (full-text article views including HTML views, PDF and ePub downloads, according to the available data) and Abstracts Views on Vision4Press platform.
Data correspond to usage on the plateform after 2015. The current usage metrics is available 48-96 hours after online publication and is updated daily on week days.
Initial download of the metrics may take a while.