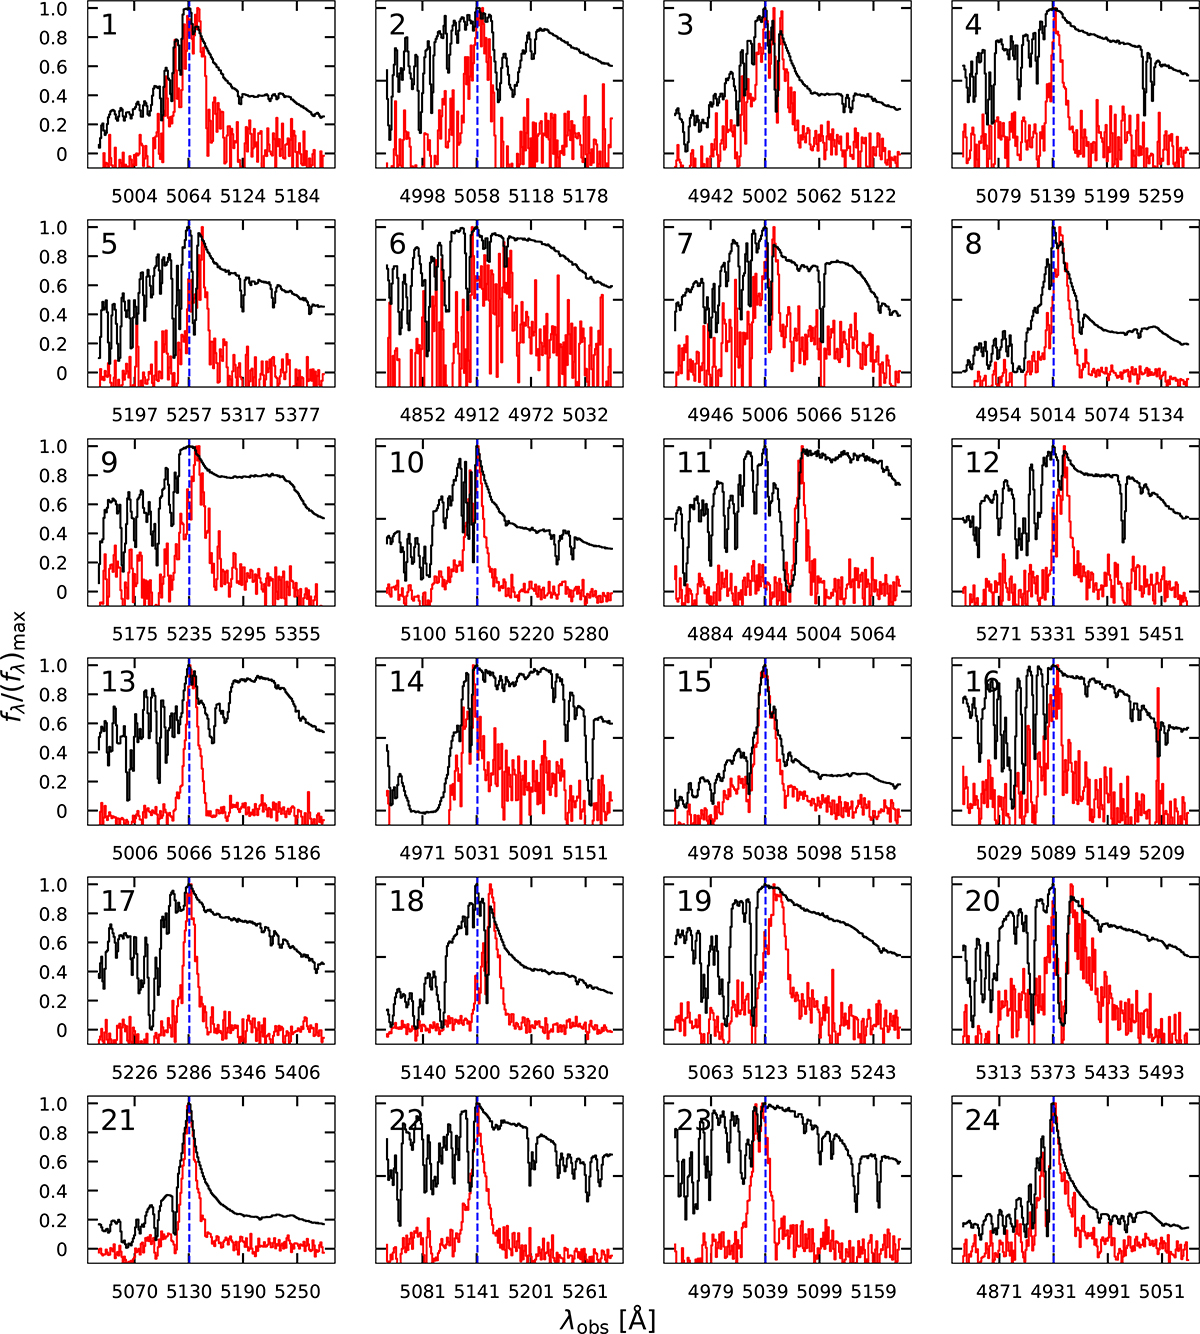
Fig. C.2.
Download original image
One-dimensional spectrum covering the Lyα line for ID 1-24 for the bright quasar sample presented in QSO MUSEUM I. The ID of each quasar is shown in the top left corner of each panel. Each panel shows a spectrum integrated from the MUSE data cube inside a 1.5” radius aperture centered at the quasar location (black line) and the integrated spectrum of each detected nebula integrated from the PSF- and continuum-subtracted data cubes within the 2σ isophotes from Figure C.1 (red line). The wavelength of the peak of the Lyα emission of each quasar is indicated with a blue vertical line. We mask the 1”×1” PSF normalization region when we extract a spectrum using the PSF- and continuum-subtracted data cubes. All the spectra are shown as normalized to their peak emission to allow comparison to Figure 2 of Arrigoni Battaia et al. (2019a).
Current usage metrics show cumulative count of Article Views (full-text article views including HTML views, PDF and ePub downloads, according to the available data) and Abstracts Views on Vision4Press platform.
Data correspond to usage on the plateform after 2015. The current usage metrics is available 48-96 hours after online publication and is updated daily on week days.
Initial download of the metrics may take a while.