Fig. 3.
Download original image
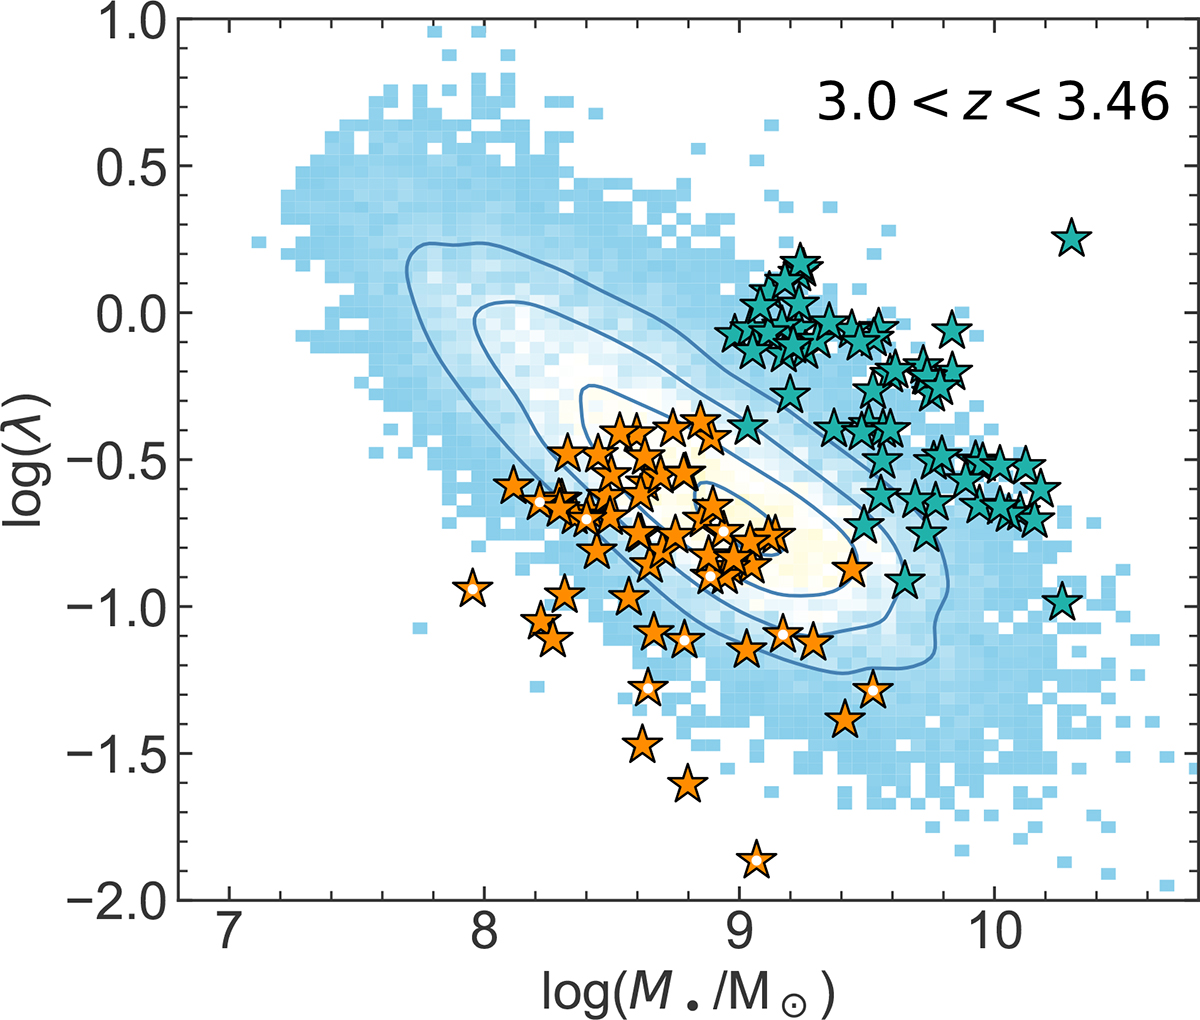
Eddington ratio vs. black hole mass for the targeted sample. The data points for the QSO MUSEUM III sample (same symbols as in Figure 2) are compared with the values for SDSS quasars in the same redshift range (blue, 2-D number density histogram; Rakshit et al. 2020). The contours indicate the iso-proportions of the density at 0.2, 0.4, 0.68 and 0.95 levels, indicating that 20%, 40%, 68%, and 95% of the quasars are outside that contour, respectively.
Current usage metrics show cumulative count of Article Views (full-text article views including HTML views, PDF and ePub downloads, according to the available data) and Abstracts Views on Vision4Press platform.
Data correspond to usage on the plateform after 2015. The current usage metrics is available 48-96 hours after online publication and is updated daily on week days.
Initial download of the metrics may take a while.