Fig. 4.
Download original image
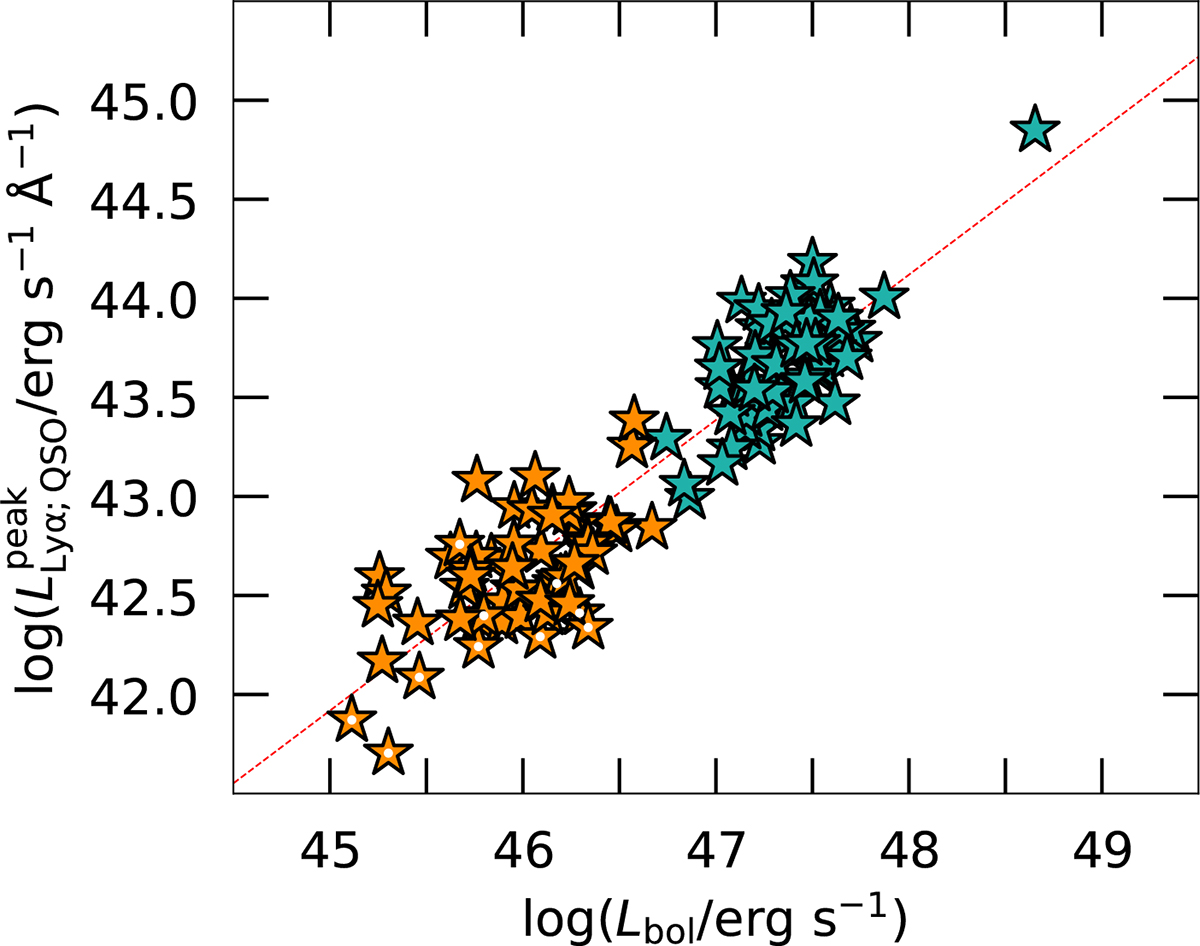
Peak Lyα luminosity density vs. bolometric luminosity of the targeted quasars. The same symbols as Figure 2 indicate the bolometric luminosity of the quasar, which is is computed using the monochromatic luminosity Lλ(1350 Å) (see Appendix B). Systems where no Lyα nebulae were detected are marked with a white dot (see Section 3.2). The dashed red line represents a power law fit to the data of the form ![]() .
.
Current usage metrics show cumulative count of Article Views (full-text article views including HTML views, PDF and ePub downloads, according to the available data) and Abstracts Views on Vision4Press platform.
Data correspond to usage on the plateform after 2015. The current usage metrics is available 48-96 hours after online publication and is updated daily on week days.
Initial download of the metrics may take a while.