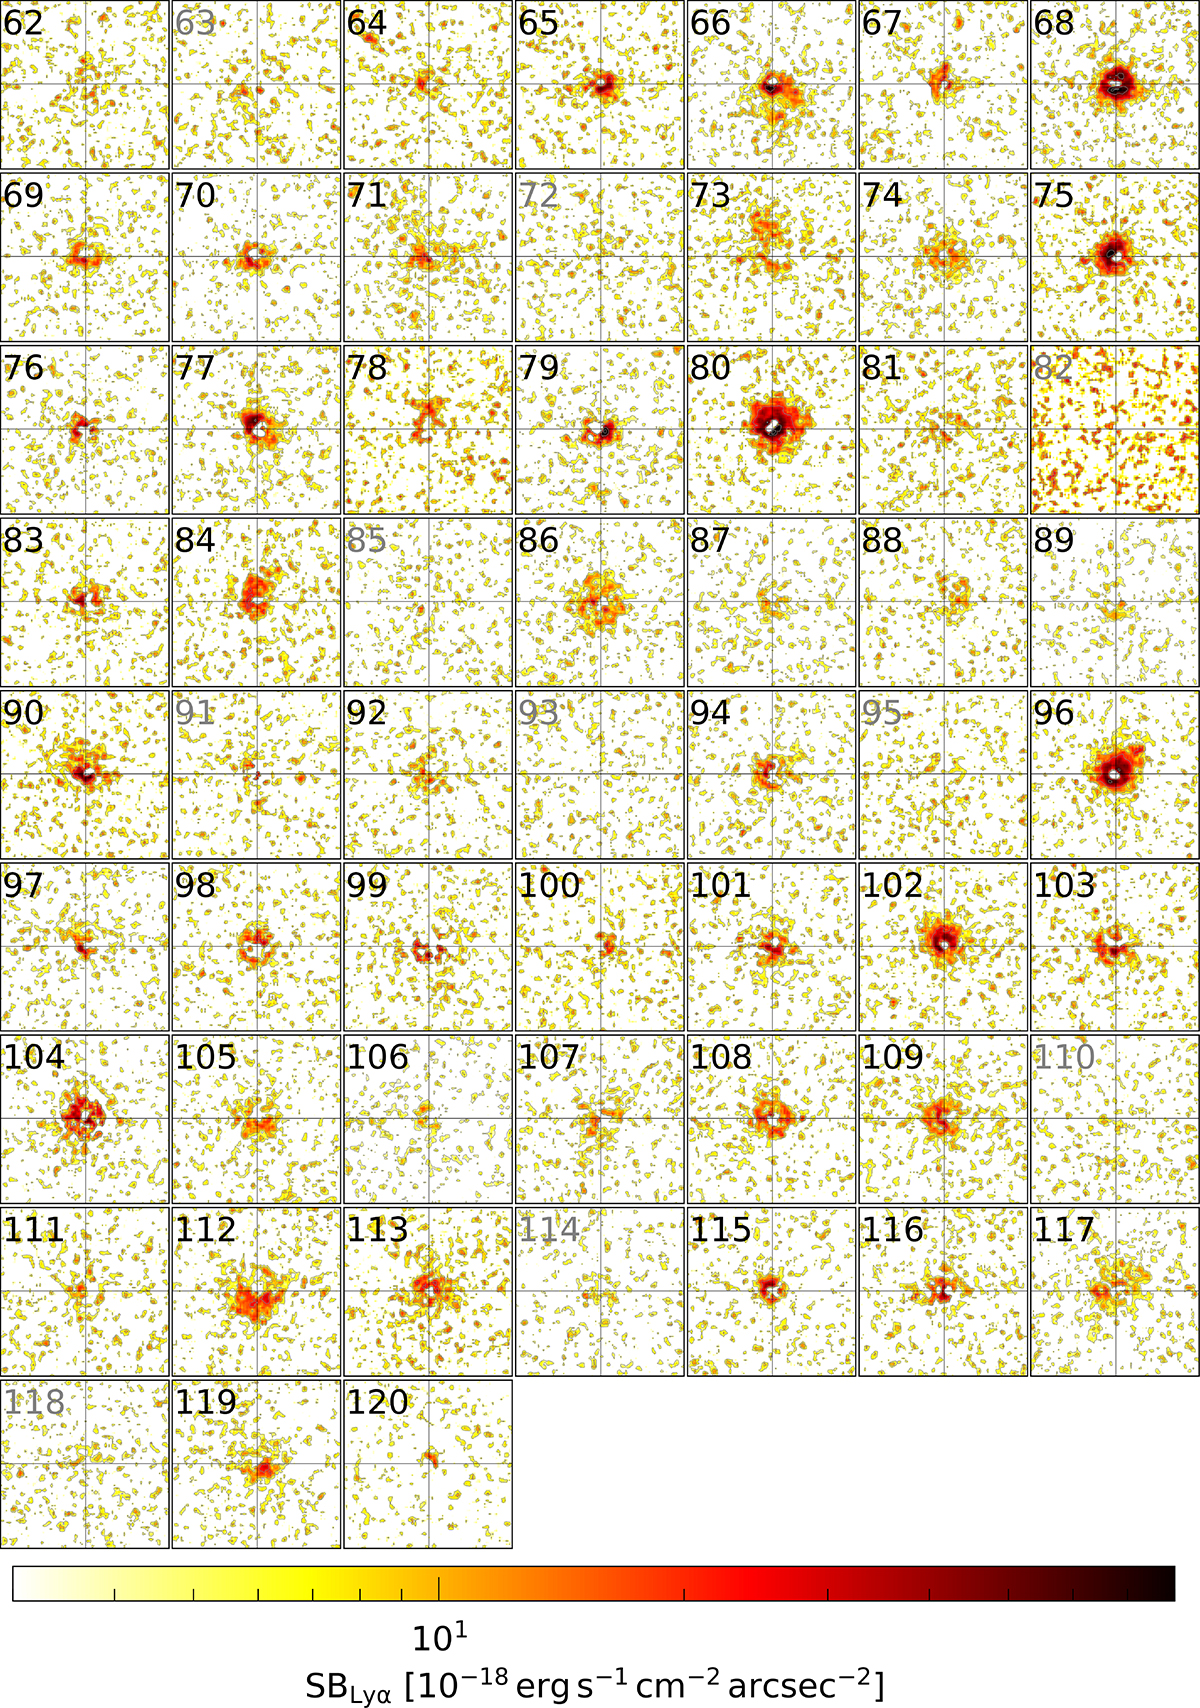
Fig. 5.
Download original image
QSO MUSEUM III atlas of the faint quasar Lyα nebulae. The Lyα SB maps around the 59 faint quasars after PSF and continuum subtraction (see Section 2.5), computed from 30 Å pseudo-NBs centered at the peak Lyα wavelength of the nebula. All images show maps with projected sizes of 20″ × 20″ (∼150 kpc × 150 kpc at the median redshift of the sample). In each map, a black crosshair indicates the location of the quasar and their ID number is indicated in top left corner. For systems with no detected nebula (Section 3.1), their ID number is indicated in color gray. The contours indicate levels of [2, 4, 10, 20, 50] times the Lyα SB limit within the pseudo-NB (Table A.1).
Current usage metrics show cumulative count of Article Views (full-text article views including HTML views, PDF and ePub downloads, according to the available data) and Abstracts Views on Vision4Press platform.
Data correspond to usage on the plateform after 2015. The current usage metrics is available 48-96 hours after online publication and is updated daily on week days.
Initial download of the metrics may take a while.