Fig. 6.
Download original image
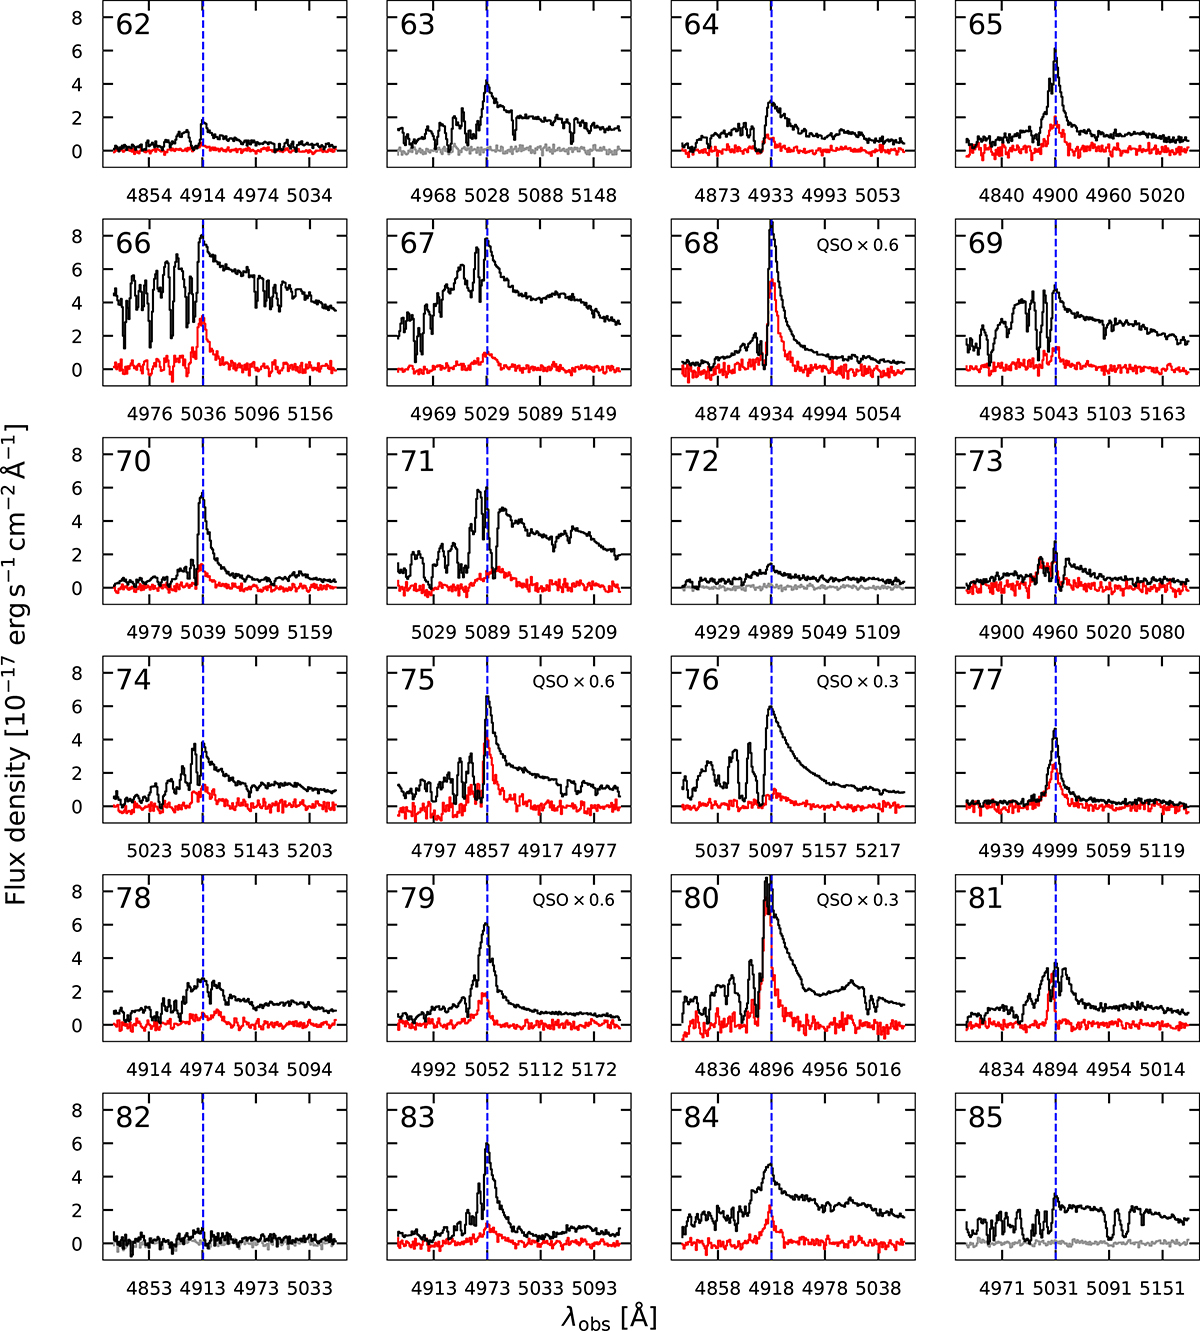
One-dimensional spectrum covering the Lyα line for ID 62-85 in the new faint quasar sample. The ID of each quasar is shown in the top left corner of each panel. Each panel shows the spectrum integrated from the MUSE data cube inside a 1.5″ radius aperture centered at the quasar location (black line) and the integrated spectrum of each detected nebula integrated from the PSF- and continuum-subtracted data cubes within the 2σ isophotes from Figure 5 (red line), respectively. The wavelength of the peak of the Lyα emission of each quasar is indicated with a blue vertical line. The gray lines are the spectra integrated within a 1.5″ radius aperture from subtracted data cubes where we found no extended Lyα emission. We mask the 1″ × 1″ PSF normalization region when extracting a spectrum using the PSF- and continuum-subtracted data cubes. All the spectra are shown with the same y-axis scale and we indicate with a label in the top right corner of the panel if the quasar spectra has been rescaled by 0.6× or 0.3× for visualization. The reminder of the spectra (IDs 86 to 120) are shown in Figures A.1 and A.2.
Current usage metrics show cumulative count of Article Views (full-text article views including HTML views, PDF and ePub downloads, according to the available data) and Abstracts Views on Vision4Press platform.
Data correspond to usage on the plateform after 2015. The current usage metrics is available 48-96 hours after online publication and is updated daily on week days.
Initial download of the metrics may take a while.