Fig. 7.
Download original image
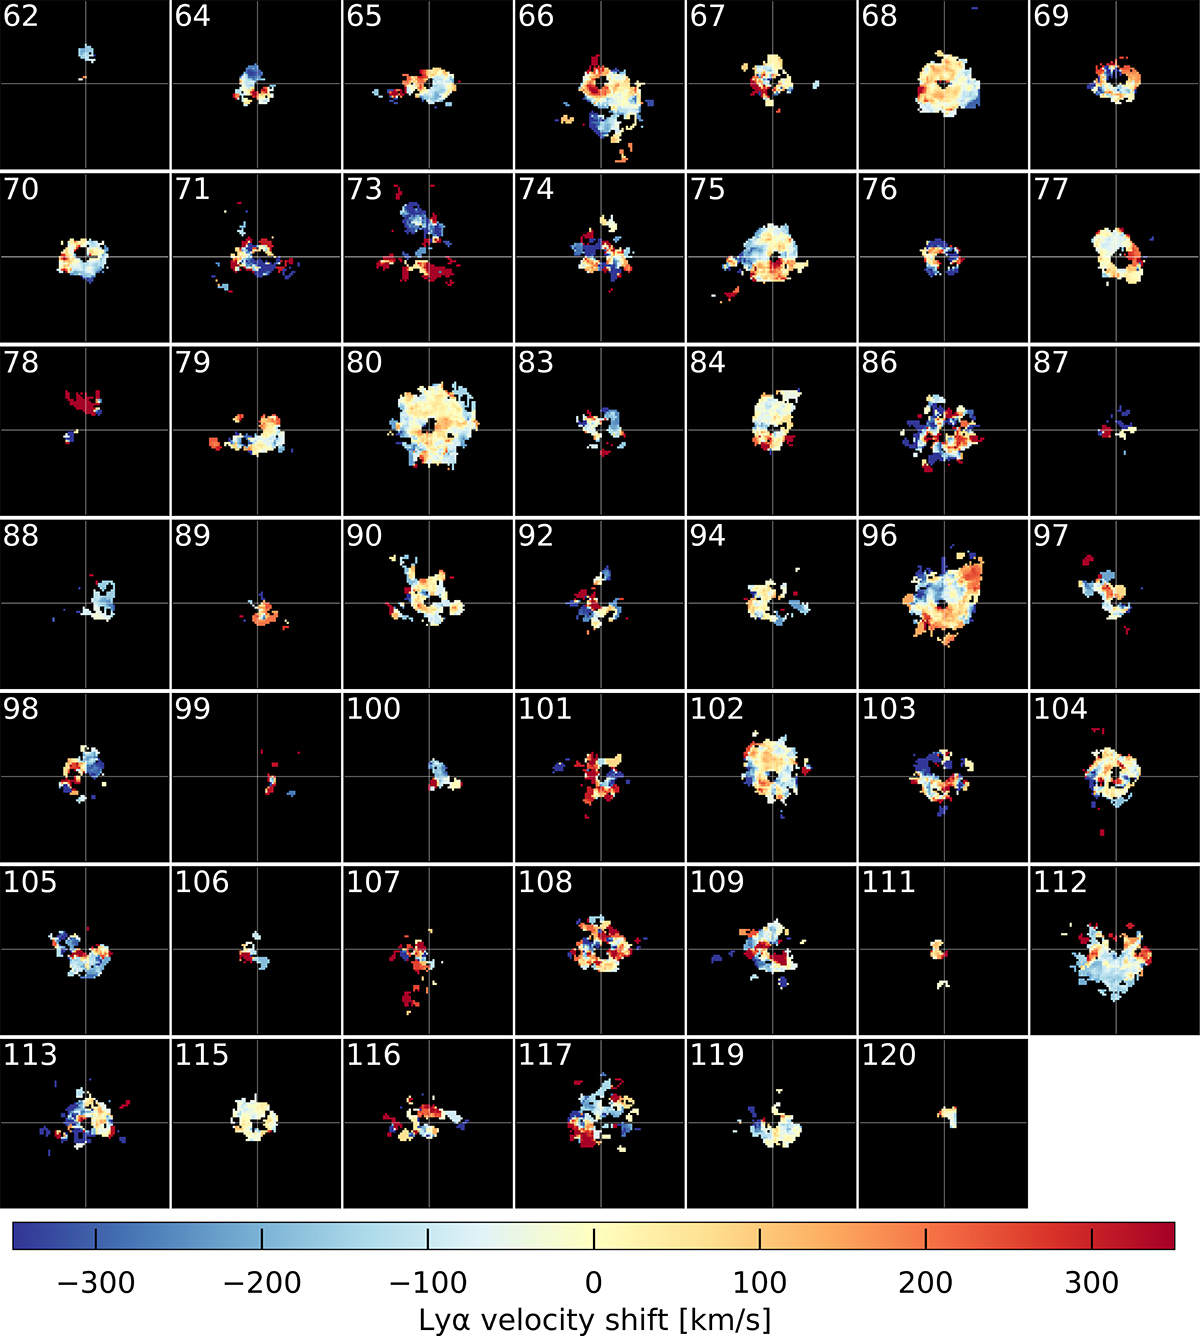
Lyα velocity shift maps of the detected nebulae around z ∼ 3 faint quasars. The Lyα velocity shift map is computed from the first moment of the PSF- and continuum-subtracted data cubes within a ±FWHMLyα with respect to the wavelength of the peak of the Lyα emission of the nebula (Table A.2). The panels are shown using the same projected scale as Figure 5 (∼150 × 150 kpc) and a white crosshair indicates the location of the quasar. The ID of each system is shown at the top left corner of each panel.
Current usage metrics show cumulative count of Article Views (full-text article views including HTML views, PDF and ePub downloads, according to the available data) and Abstracts Views on Vision4Press platform.
Data correspond to usage on the plateform after 2015. The current usage metrics is available 48-96 hours after online publication and is updated daily on week days.
Initial download of the metrics may take a while.