Fig. 9.
Download original image
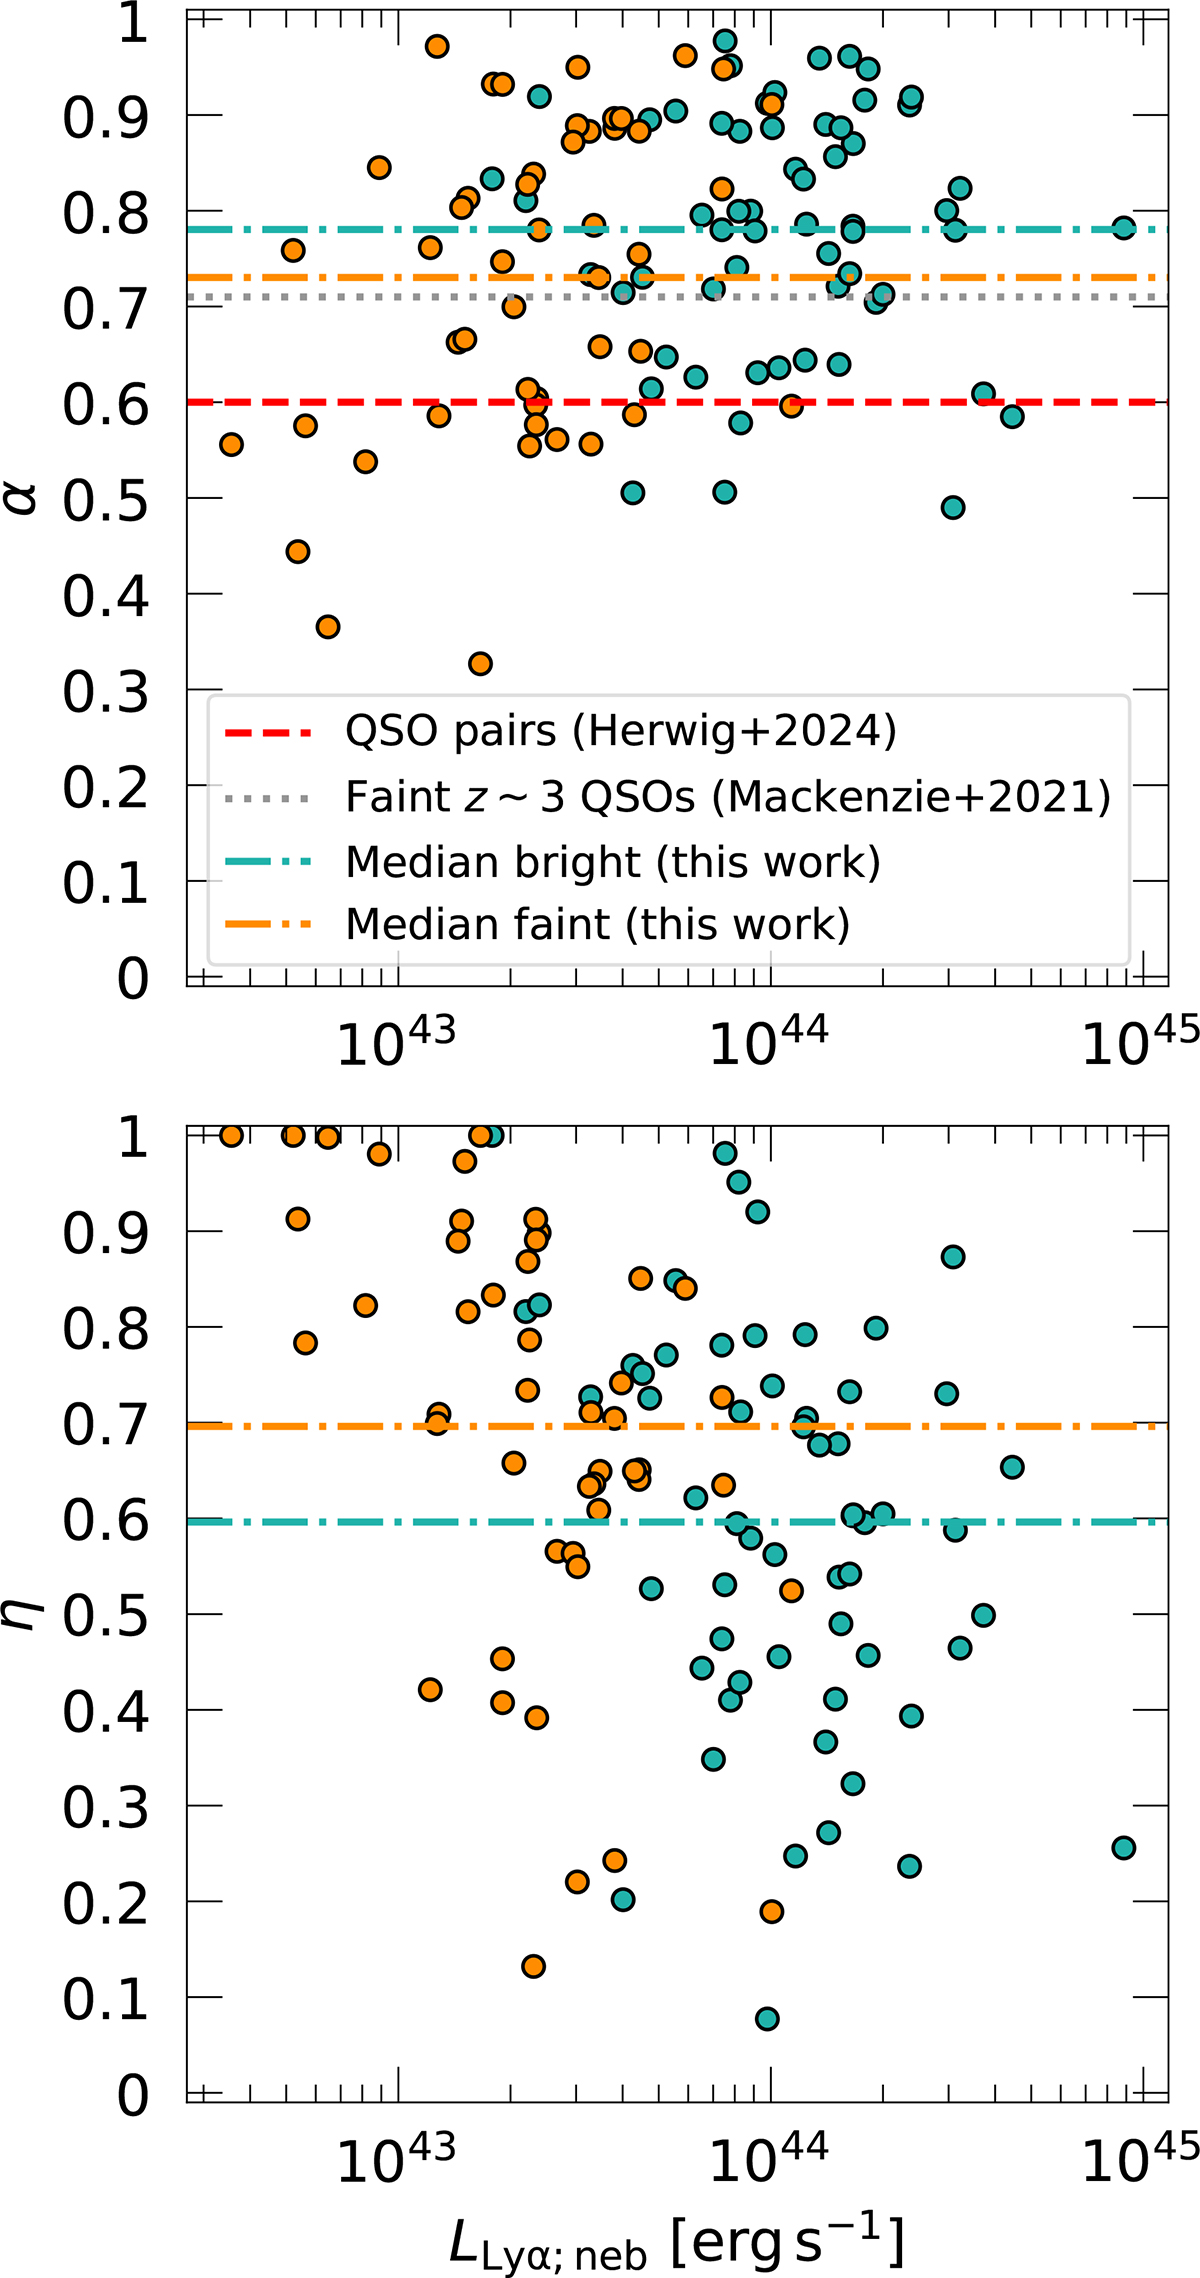
Level of elongation (α) and lopsidedness (η) of the observed extended Lyα emission around quasars. In both panels, the orange and dark green points indicate the faint and bright sample of QSO MUSEUM III, respectively. The median values of the faint and bright samples are indicated with dot-dashed lines of the same colors. Top: Elongation α computed from the Stokes parameters (see Section 3.3) within the 2σ isophote of the detected nebulae as a function of nebula Lyα luminosity. Larger values of α indicate a rounder morphology. Additionally, we show the median values of α reported in the faint z ∼ 3 quasar sample from Mackenzie et al. (2021) and quasar pairs from QSO MUSEUM II with a gray dotted and dashed red line, respectively. Bottom: Nebula lopsidedness η as presented in Arrigoni Battaia et al. (2023b) and described in the text. High values correspond to all emission within the 2σ isophote being on one side of the quasar.
Current usage metrics show cumulative count of Article Views (full-text article views including HTML views, PDF and ePub downloads, according to the available data) and Abstracts Views on Vision4Press platform.
Data correspond to usage on the plateform after 2015. The current usage metrics is available 48-96 hours after online publication and is updated daily on week days.
Initial download of the metrics may take a while.