Fig. 1
Download original image
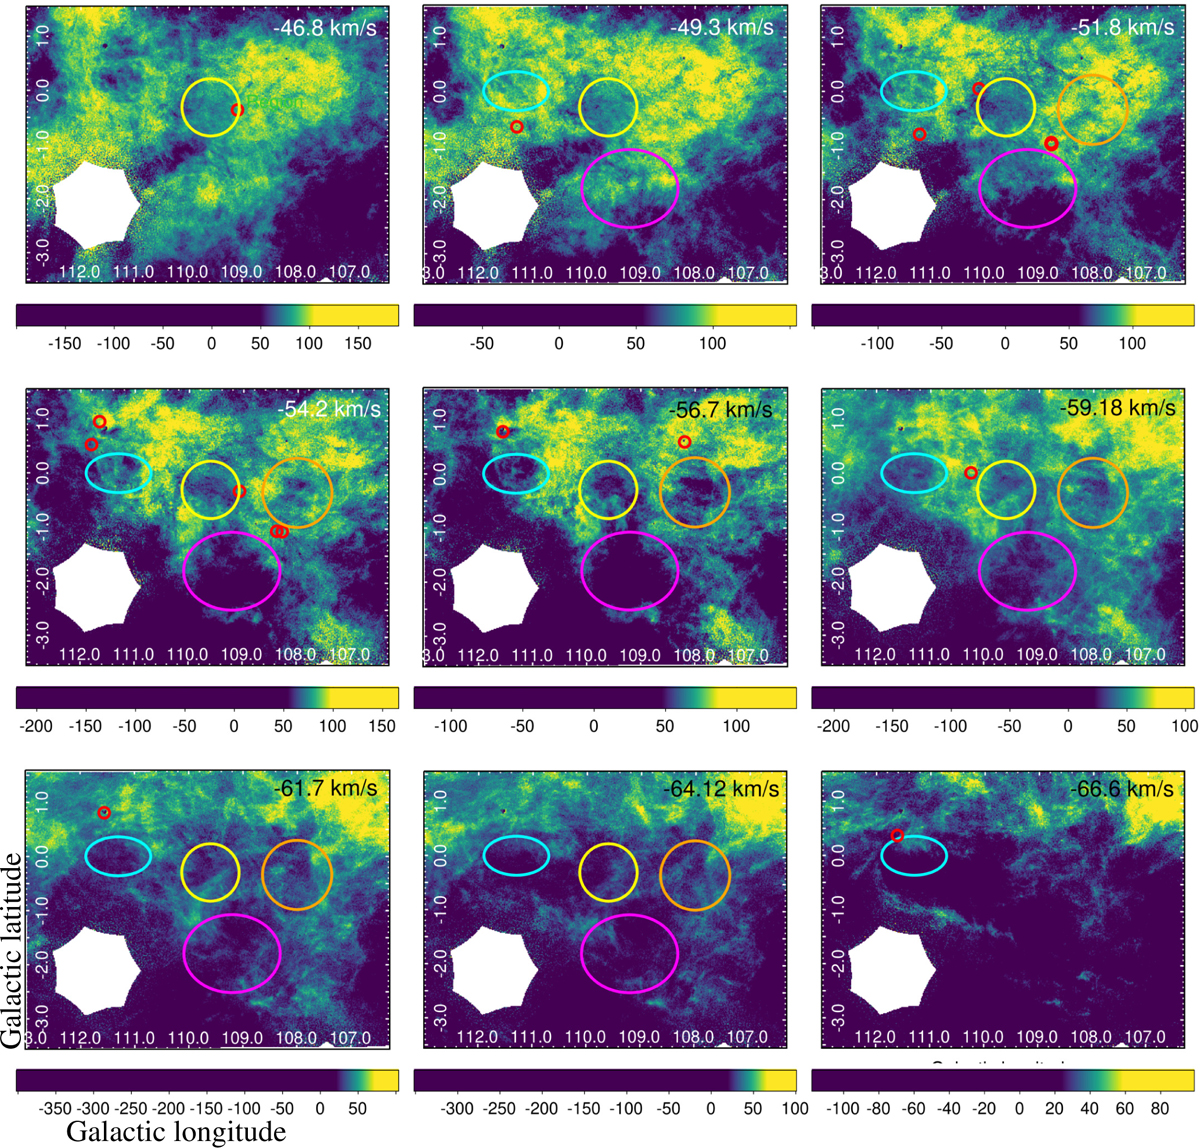
CGPS H I emission distribution in velocity range from −46.0 to −67.4 km s−1. Each panel is an average of three consecutive velocity channel maps, with the central Local Standard of Rest (LSR) velocity indicated in its top right corner. The colour bars show the brightness temperature in kelvin. The four H I shells are outlined in orange (1), magenta (2), yellow (3), and cyan (4). H II regions are marked with red circles (see Sect. 4).
Current usage metrics show cumulative count of Article Views (full-text article views including HTML views, PDF and ePub downloads, according to the available data) and Abstracts Views on Vision4Press platform.
Data correspond to usage on the plateform after 2015. The current usage metrics is available 48-96 hours after online publication and is updated daily on week days.
Initial download of the metrics may take a while.