Fig. 4
Download original image
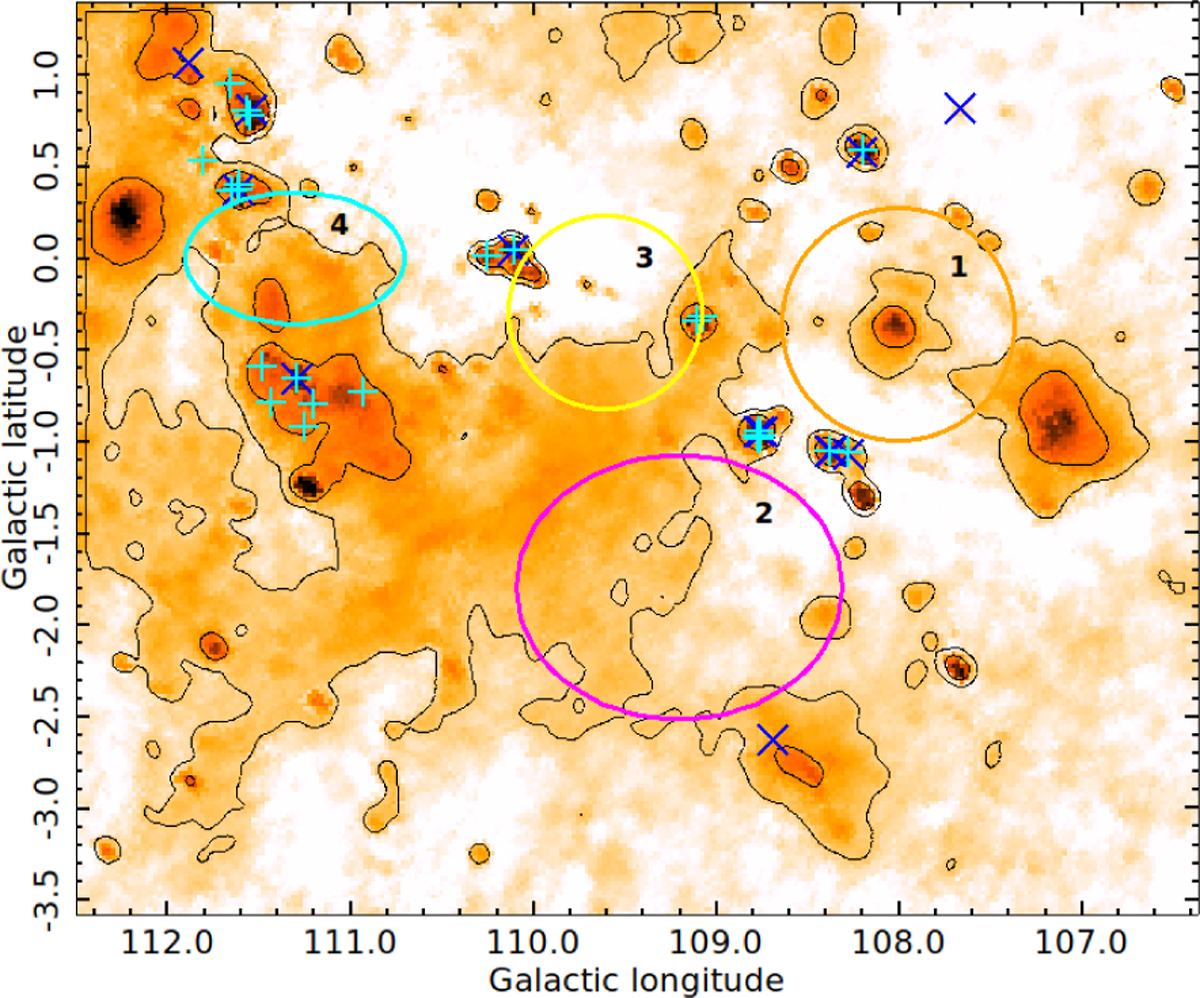
Dust temperature map derived from emission distributions at 60 and 100 μm. The cyan (+) and blue (x) symbols mark the position of the H II regions from the WISE and Sharpless catalogues, respectively. These represent a subsample of the catalogued H II regions, whose selection criteria are described in Sect. 4. Contours are at 25 and 27 K. Coloured ellipses mark the locations of the four H I shells.
Current usage metrics show cumulative count of Article Views (full-text article views including HTML views, PDF and ePub downloads, according to the available data) and Abstracts Views on Vision4Press platform.
Data correspond to usage on the plateform after 2015. The current usage metrics is available 48-96 hours after online publication and is updated daily on week days.
Initial download of the metrics may take a while.