Fig. 5
Download original image
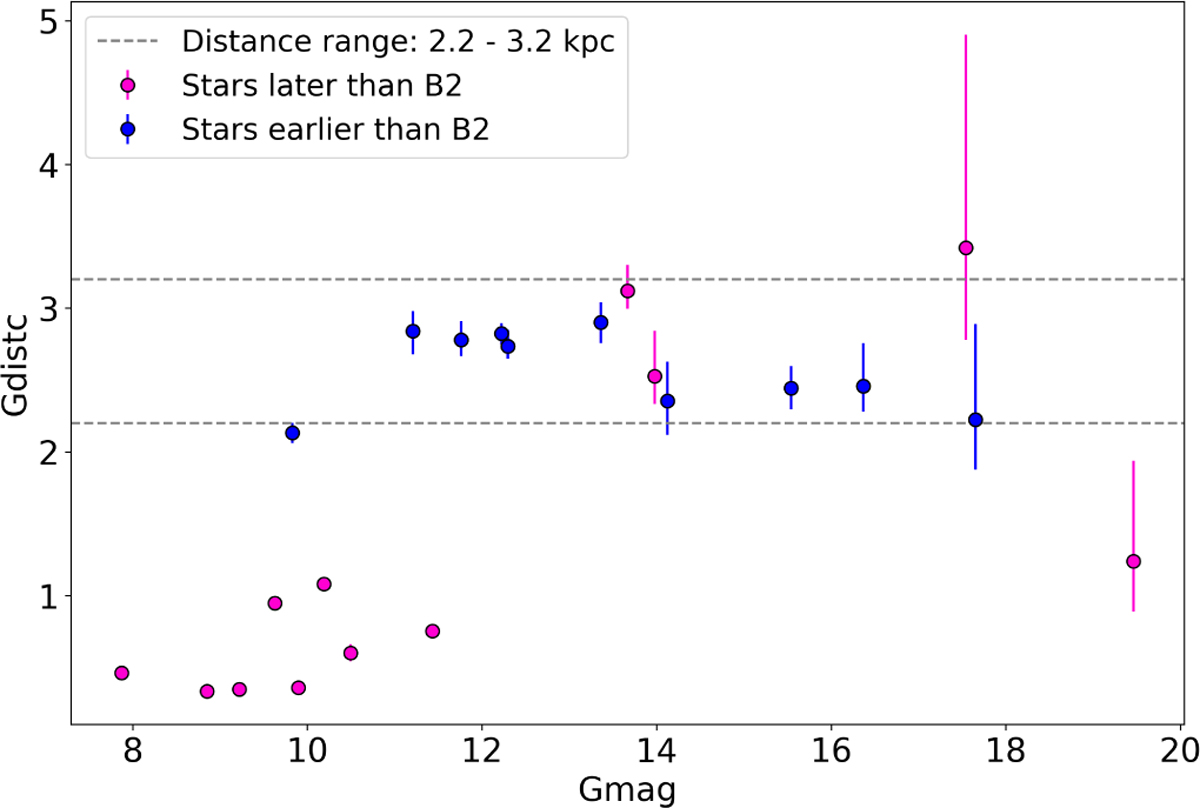
Gaia Gmag versus distance (from Bailer-Jones et al. 2021) for stars located within H II regions listed in Table 2. Blue dots correspond to spectral types earlier than B2, and pink dots to spectral types later than B2. Vertical lines show the distance uncertainties. Dashed lines mark the adopted distance limits of 2.2 and 3.2 kpc.
Current usage metrics show cumulative count of Article Views (full-text article views including HTML views, PDF and ePub downloads, according to the available data) and Abstracts Views on Vision4Press platform.
Data correspond to usage on the plateform after 2015. The current usage metrics is available 48-96 hours after online publication and is updated daily on week days.
Initial download of the metrics may take a while.