Open Access
Fig. 7
Download original image
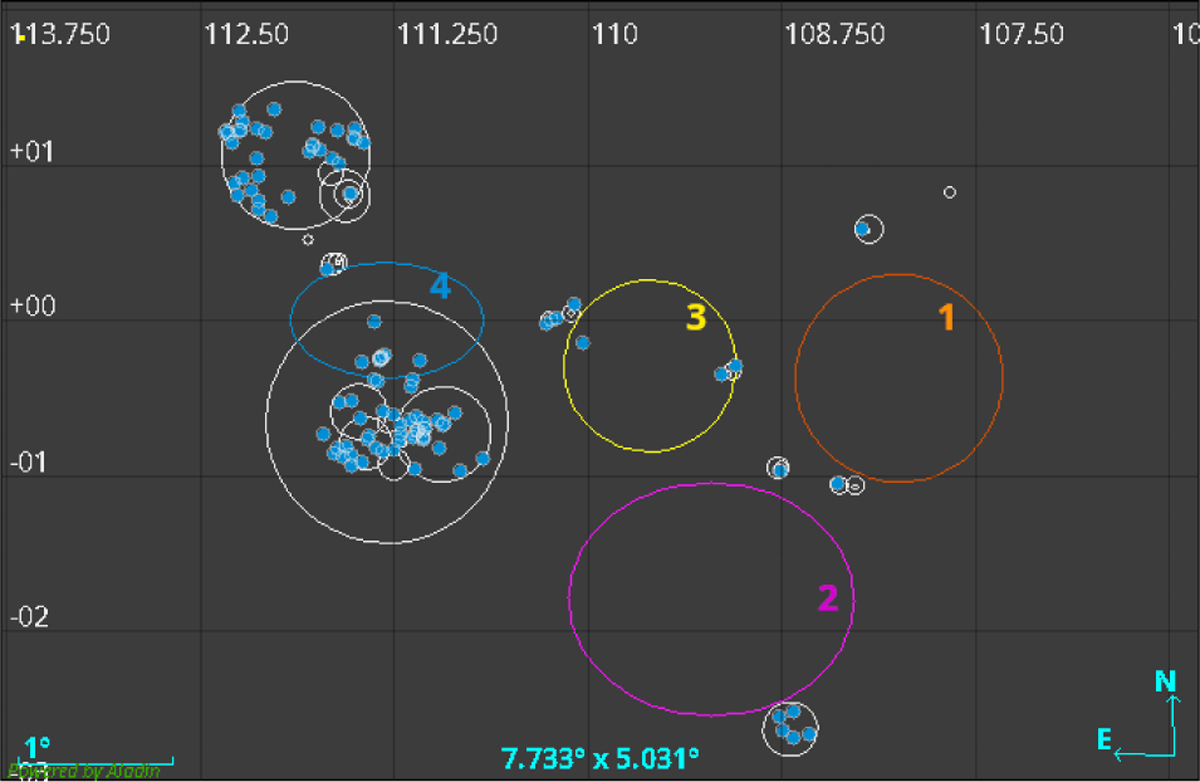
Map showing spatial distribution of analysed structures. The coloured ellipses and circles indicate the position and size of the H I shells, as depicted in Fig. 1. The white circles show the H II regions, while the blue dots indicate the massive star candidates.
Current usage metrics show cumulative count of Article Views (full-text article views including HTML views, PDF and ePub downloads, according to the available data) and Abstracts Views on Vision4Press platform.
Data correspond to usage on the plateform after 2015. The current usage metrics is available 48-96 hours after online publication and is updated daily on week days.
Initial download of the metrics may take a while.