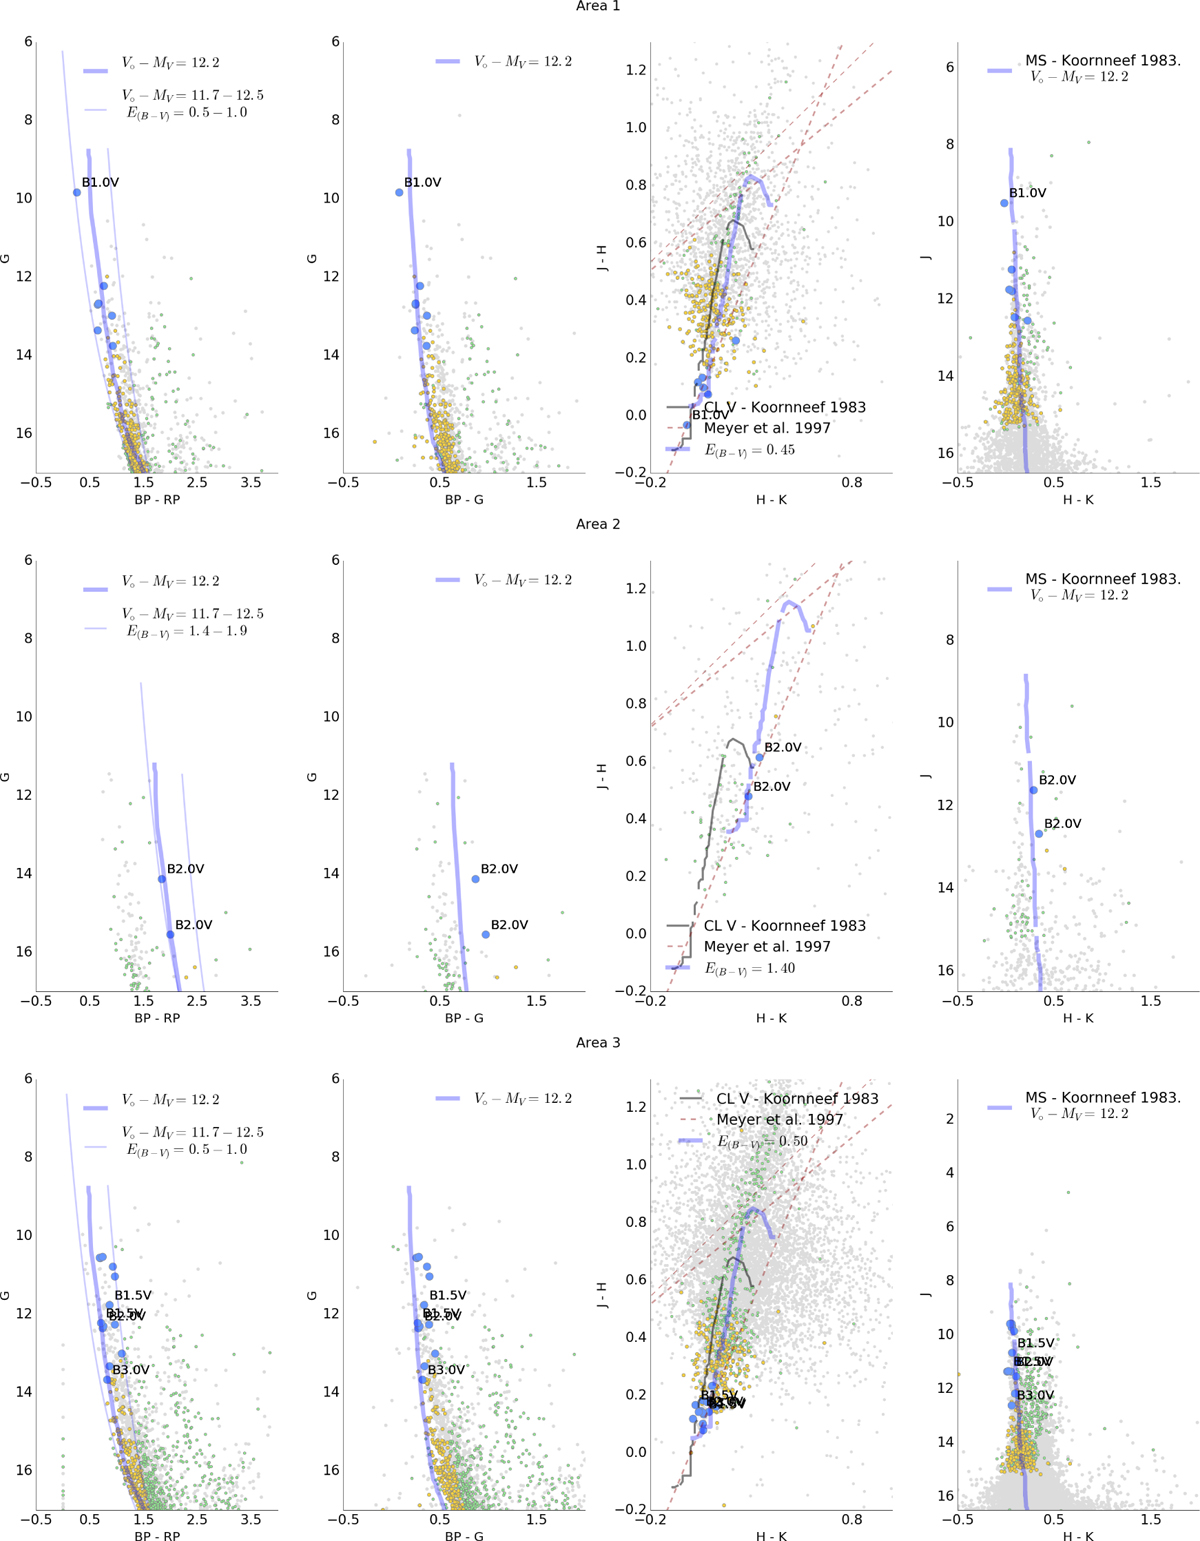
Fig. A.1
Download original image
Photometric diagrams for 11 areas containing massive-star candidates (area label at top of each panel). The MS locus is the thick blue line; thin blue lines enclose the selected region (Sect. 5). Coloured circles mark sources at 2.2–3.2 kpc; grey dots are outside this range. Massive-star candidates are shown as blue circles (labels give ST). Potential low-mass stars are yellow; discarded sources are green.
Current usage metrics show cumulative count of Article Views (full-text article views including HTML views, PDF and ePub downloads, according to the available data) and Abstracts Views on Vision4Press platform.
Data correspond to usage on the plateform after 2015. The current usage metrics is available 48-96 hours after online publication and is updated daily on week days.
Initial download of the metrics may take a while.