Fig. 9
Download original image
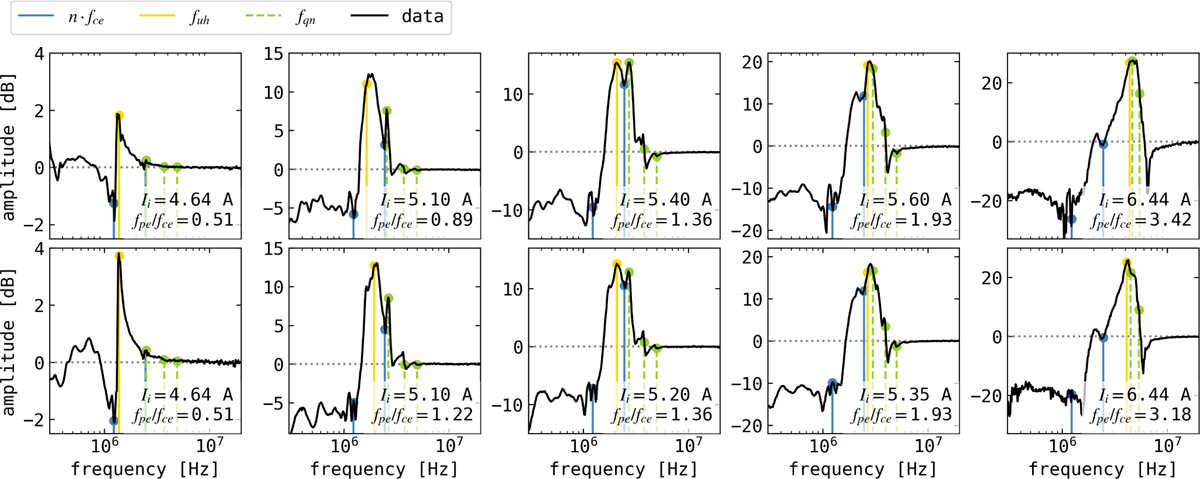
Representative set of magnetized mutual impedance amplitude spectra, normalized to vacuum, in the upper (lower) row with the antenna perpendicular (parallel) to the axis of the plasma chamber. The plasma density increases from left to right. The ionization filament current Ii is indicated in each panel, with the ratio of the plasma to electron cyclotron frequency fpe/fce. The following characteristic frequencies are shown as vertical lines: the harmonics of the electron cyclotron frequency, the upper hybrid frequency, and the series of fqn frequencies.
Current usage metrics show cumulative count of Article Views (full-text article views including HTML views, PDF and ePub downloads, according to the available data) and Abstracts Views on Vision4Press platform.
Data correspond to usage on the plateform after 2015. The current usage metrics is available 48-96 hours after online publication and is updated daily on week days.
Initial download of the metrics may take a while.