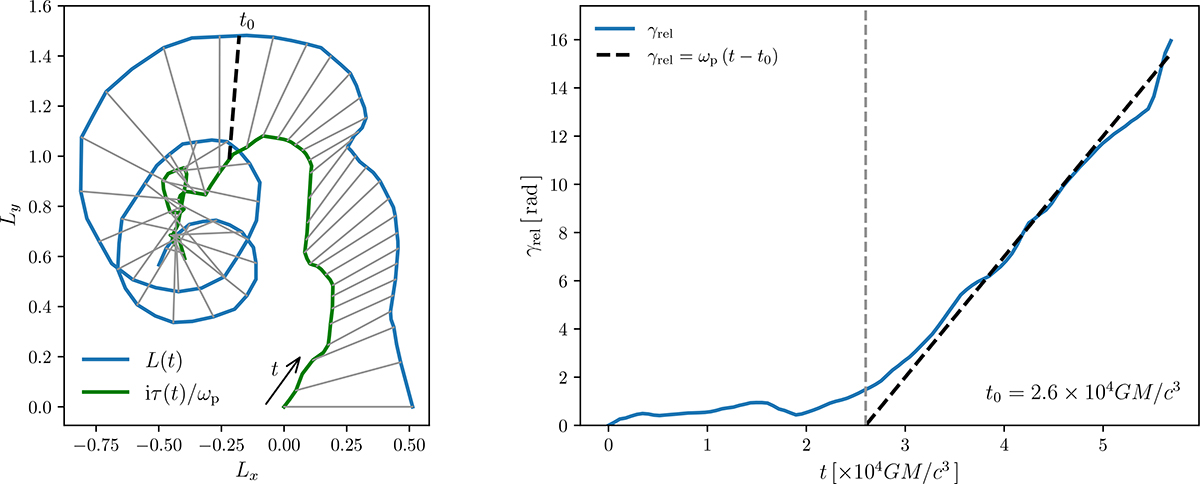
Fig. A.1.
Download original image
Left: Evolution of the torus angular-momentum vector L(t) (blue line) and the precession axis given by the torque, Laxis(t) = iτacc(t)/ωp (green line) in the simulation. The gray lines show their relative position at times spaced by constant intervals of Δt = 1.148 × 10³(GM/c3). Right: Precession angle relative to the precession axis Laxis as function of time, γrel(t) = arg[L(t)−iτ(t)/ωp]. Starting at t0 = 2.6 × 10³(GM/c3) the torus executes a nearly steady precession with frequency ωp = 5 × 10⁻⁴c3/(GM).
Current usage metrics show cumulative count of Article Views (full-text article views including HTML views, PDF and ePub downloads, according to the available data) and Abstracts Views on Vision4Press platform.
Data correspond to usage on the plateform after 2015. The current usage metrics is available 48-96 hours after online publication and is updated daily on week days.
Initial download of the metrics may take a while.