Fig. B.2.
Download original image
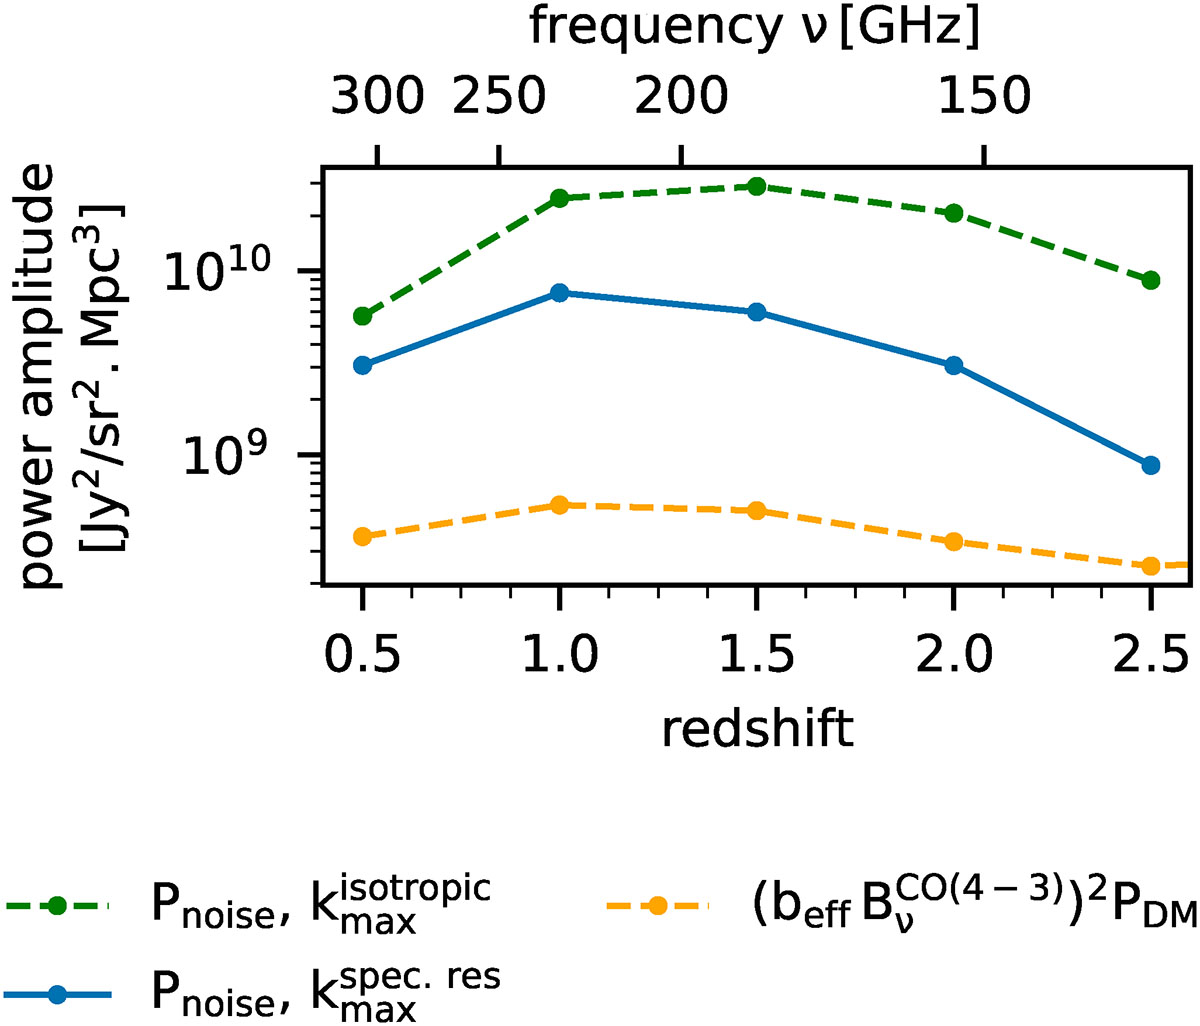
Power amplitudes of the terms entering the expression of σJup − G(k) (Eq B.8). The orange dashed line shows the power amplitude of the cross-term ![]() . The green dashed line shows the white noise power amplitude integrated over the k-range 0.1-0.35 Mpc−1. In contrast, the blue solid line shows the white noise power amplitude integrated up to kmax defined in Eq. B.15. Overall, the condition
. The green dashed line shows the white noise power amplitude integrated over the k-range 0.1-0.35 Mpc−1. In contrast, the blue solid line shows the white noise power amplitude integrated up to kmax defined in Eq. B.15. Overall, the condition ![]() is verified, but when restricting the integral to the smallest accessible scale in the radial direction, PnoisePG exceeds the cross-term PJup × G only by a factor of a few.
is verified, but when restricting the integral to the smallest accessible scale in the radial direction, PnoisePG exceeds the cross-term PJup × G only by a factor of a few.
Current usage metrics show cumulative count of Article Views (full-text article views including HTML views, PDF and ePub downloads, according to the available data) and Abstracts Views on Vision4Press platform.
Data correspond to usage on the plateform after 2015. The current usage metrics is available 48-96 hours after online publication and is updated daily on week days.
Initial download of the metrics may take a while.