Fig. 3.
Download original image
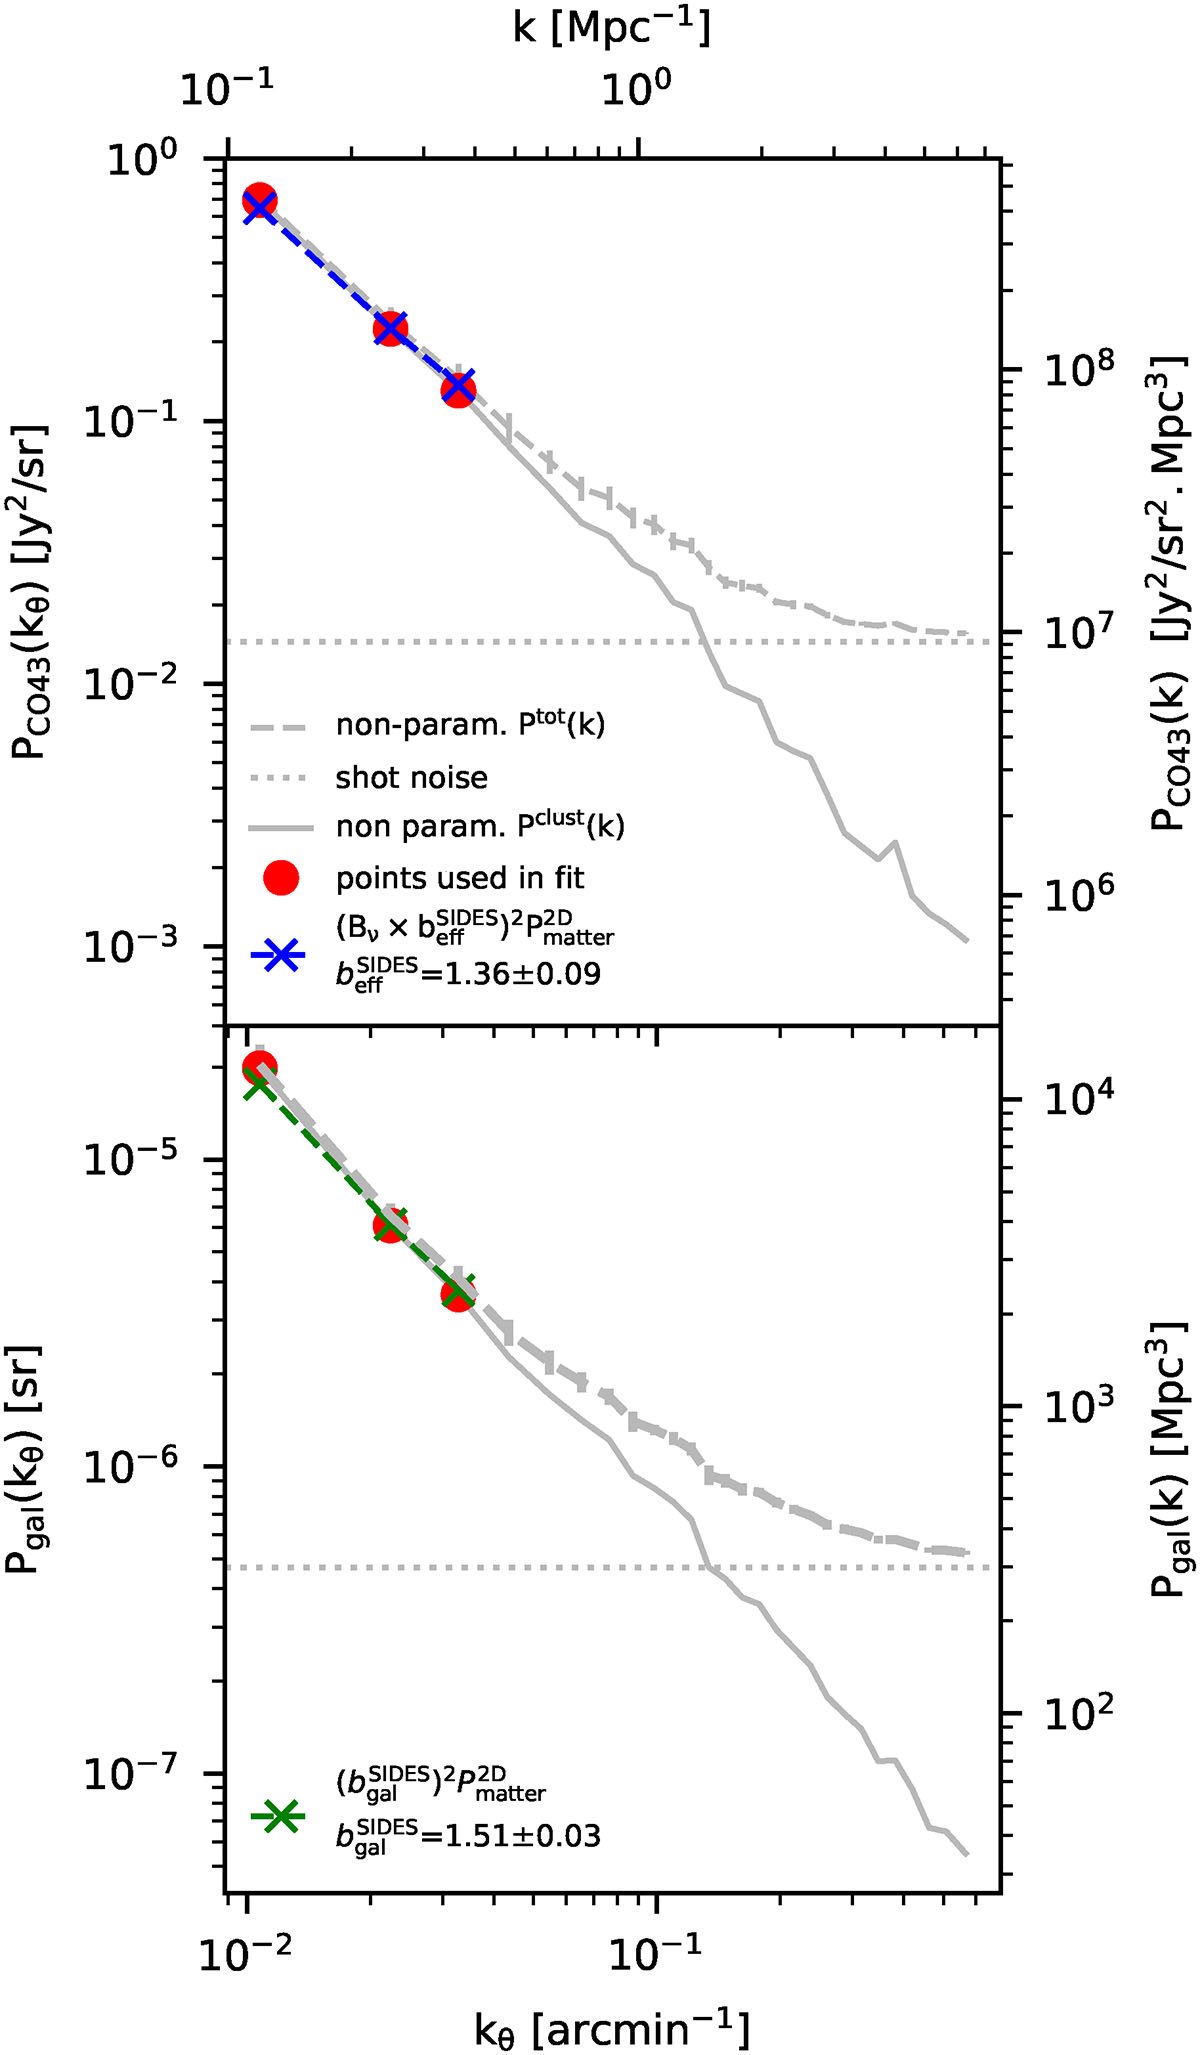
Upper panel: CO(4–3) auto-power spectrum at z = 0.5. The dashed gray line shows the simulation-based auto-power spectrum Ptot(k). It is the average over the five auto-power spectra of CO(4–3) maps, each map spanning δz = 0.05. The dotted gray line shows the average shot noise component. Subtracting the shot noise yields the clustering Pclust(k) shown with the solid gray line. The clustering (Eq. (11)) is fit to Pclust at large scales only, using the red points. From this fit, the effective clustering bias in SIDES, ![]() , is estimated. Lower panel: Same procedure for galaxies’ auto-power spectra and
, is estimated. Lower panel: Same procedure for galaxies’ auto-power spectra and ![]() , still at z = 0.5.
, still at z = 0.5.
Current usage metrics show cumulative count of Article Views (full-text article views including HTML views, PDF and ePub downloads, according to the available data) and Abstracts Views on Vision4Press platform.
Data correspond to usage on the plateform after 2015. The current usage metrics is available 48-96 hours after online publication and is updated daily on week days.
Initial download of the metrics may take a while.