Fig. 4.
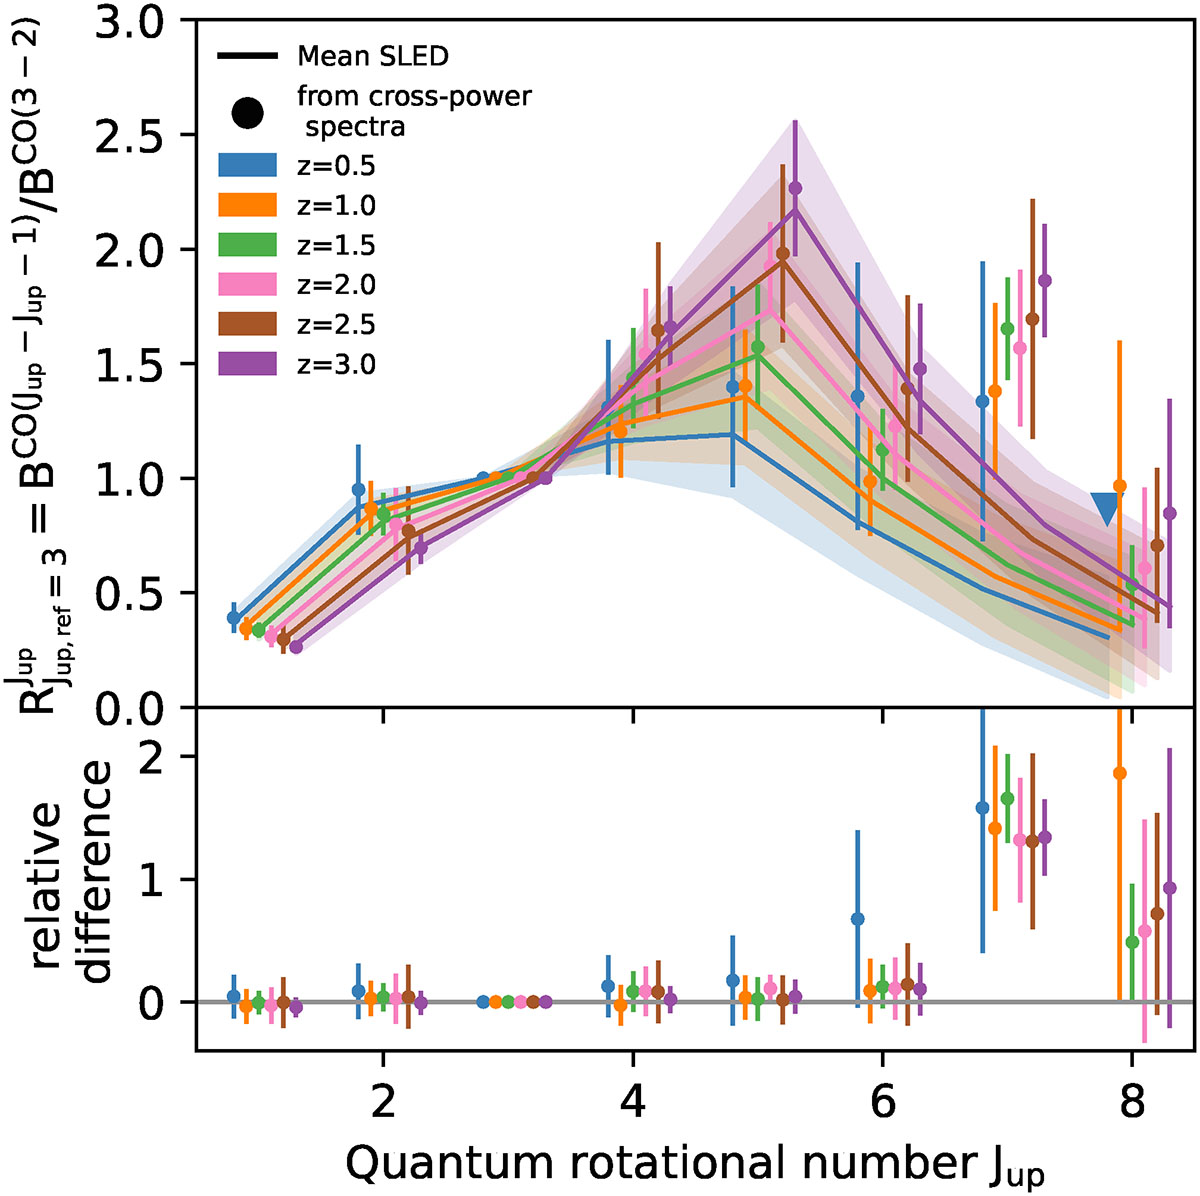
Download original image
CO SLED and its evolution with redshift. Points have been shifted in the x-axis for clarity. The transition used for normalization is Jup = 3. Colors encode the redshift, from z = 0.5 to 3.0. In the upper panel, solid lines and shaded areas are the mean and 1σ deviation of the background SLED from the SIDES-Uchuu catalog. Points are obtained from Eq. (15) (and thus from the ratio of clustering power spectra) and the associated error bars from the dispersion over the 12 subfields of 9 deg2. The lower panel shows the relative difference between the mean SLED from the catalog and the measurement from the cross-power spectra.
Current usage metrics show cumulative count of Article Views (full-text article views including HTML views, PDF and ePub downloads, according to the available data) and Abstracts Views on Vision4Press platform.
Data correspond to usage on the plateform after 2015. The current usage metrics is available 48-96 hours after online publication and is updated daily on week days.
Initial download of the metrics may take a while.