Open Access
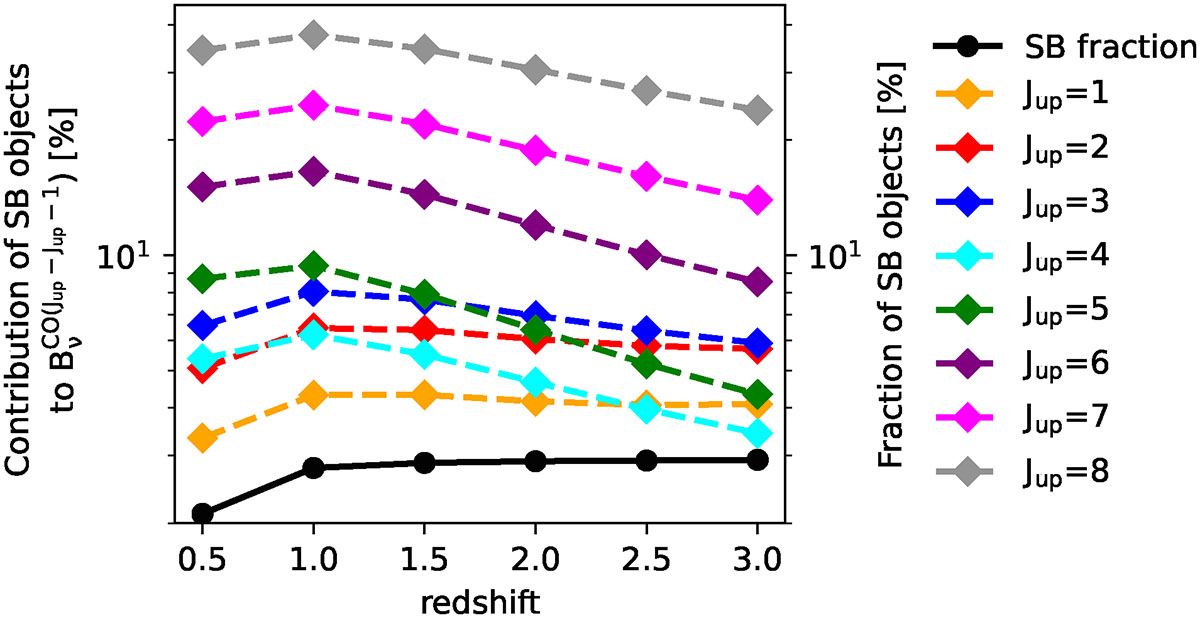
Fig. 5.
Download original image
Left axis and colored dashed curves: Starburst’s contribution to mean brightness of transitions, as function of redshift up to Jup = 8, inferred from the SIDES-Uchuu catalog. Right axis and solid black curve: Starburst fraction in SIDES catalog.
Current usage metrics show cumulative count of Article Views (full-text article views including HTML views, PDF and ePub downloads, according to the available data) and Abstracts Views on Vision4Press platform.
Data correspond to usage on the plateform after 2015. The current usage metrics is available 48-96 hours after online publication and is updated daily on week days.
Initial download of the metrics may take a while.