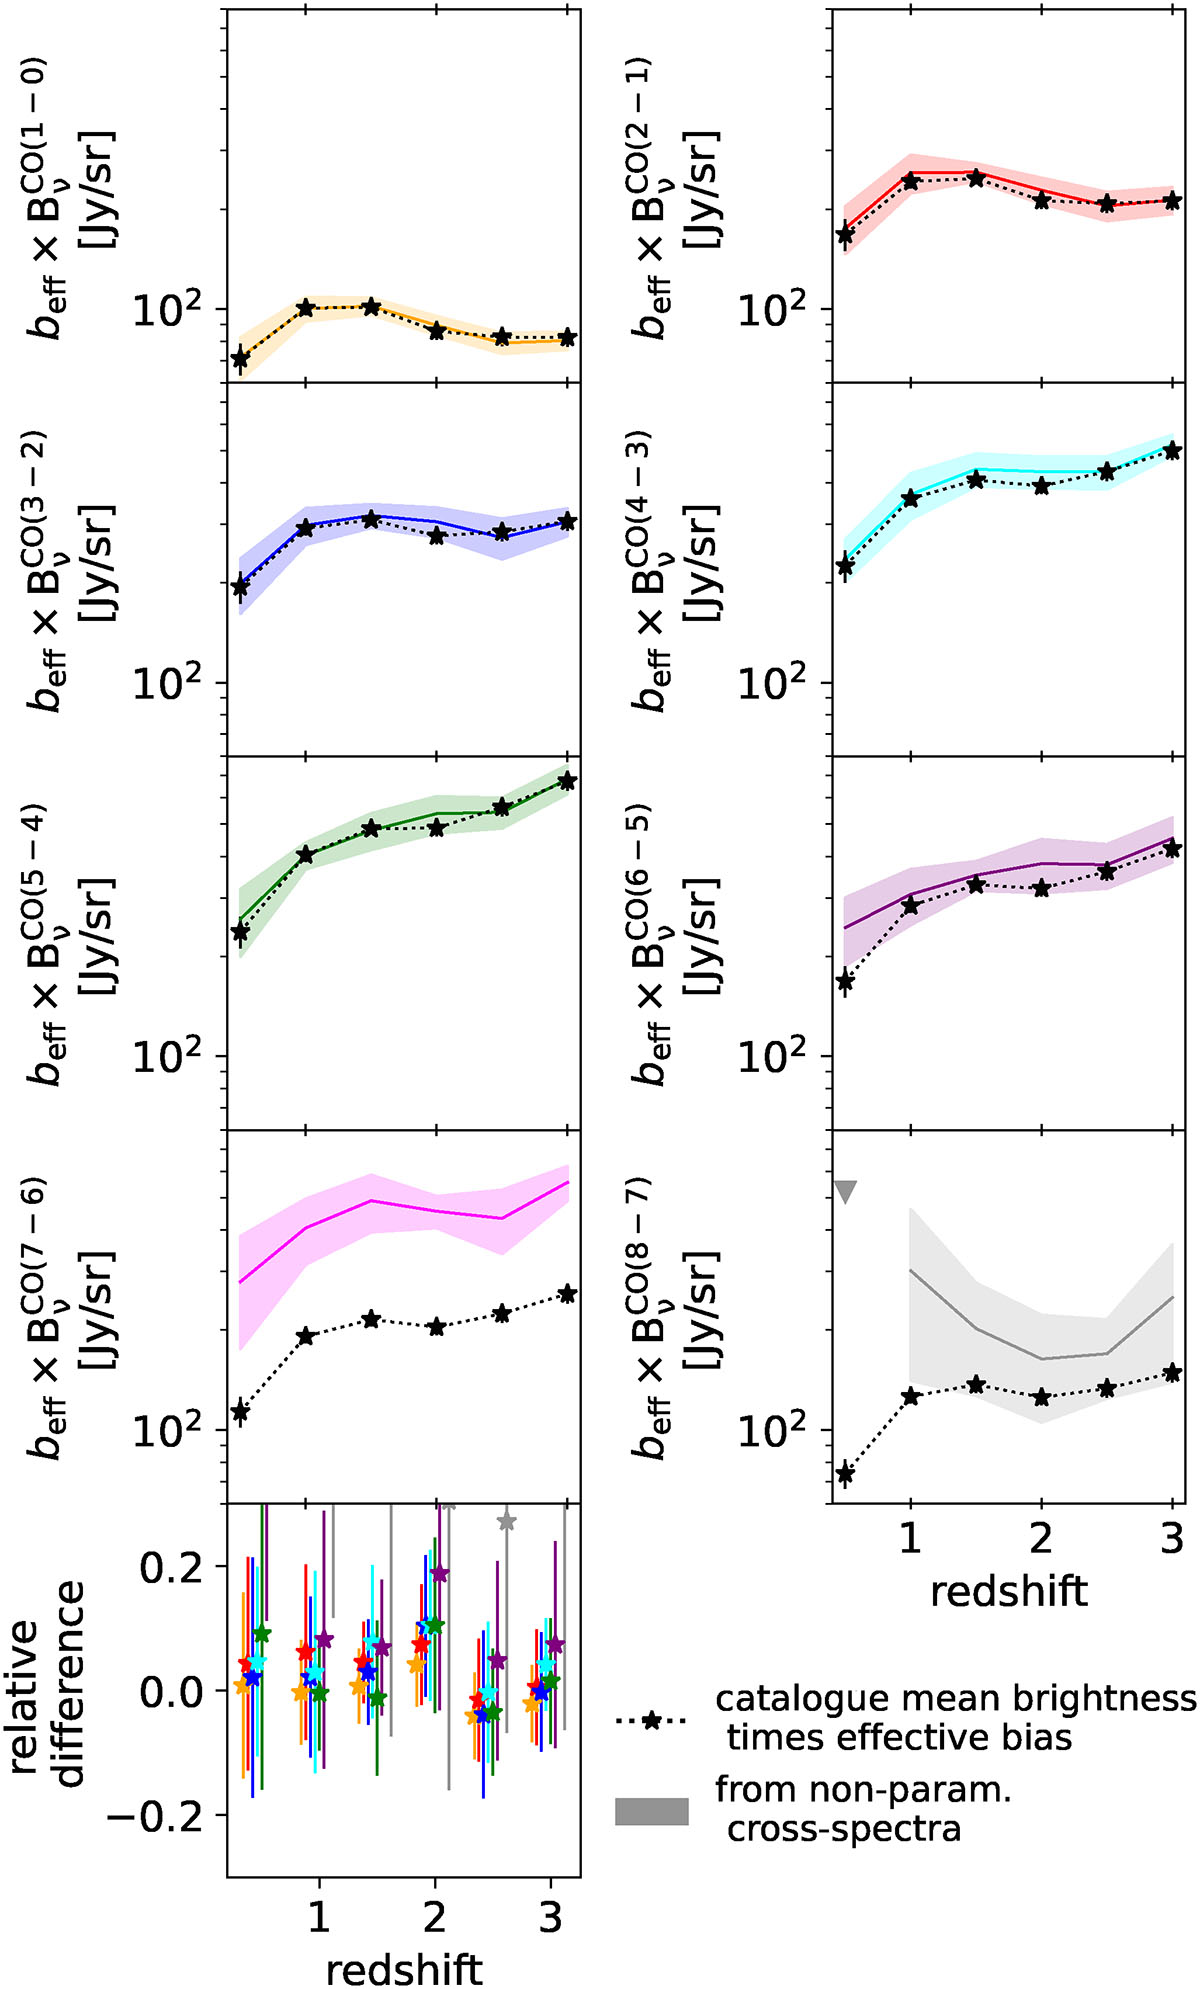
Fig. 6.
Download original image
CO bias-weighted intensities as function of redshift. The color-code stands for the transitions’ Jup from 1 to 8. Solid lines and shaded areas correspond to the mean and 1σ dispersion, respectively, on the measured bias-weighted intensities from the 12 9 deg2 fields. Black dotted stars show the mean brightness derived analytically times the SIDES effective clustering bias ![]() . The last panel in the left column shows the relative difference between the simulation-based and analytic bias-weighted intensities (i.e., the relative difference between colored lines and stars).
. The last panel in the left column shows the relative difference between the simulation-based and analytic bias-weighted intensities (i.e., the relative difference between colored lines and stars).
Current usage metrics show cumulative count of Article Views (full-text article views including HTML views, PDF and ePub downloads, according to the available data) and Abstracts Views on Vision4Press platform.
Data correspond to usage on the plateform after 2015. The current usage metrics is available 48-96 hours after online publication and is updated daily on week days.
Initial download of the metrics may take a while.