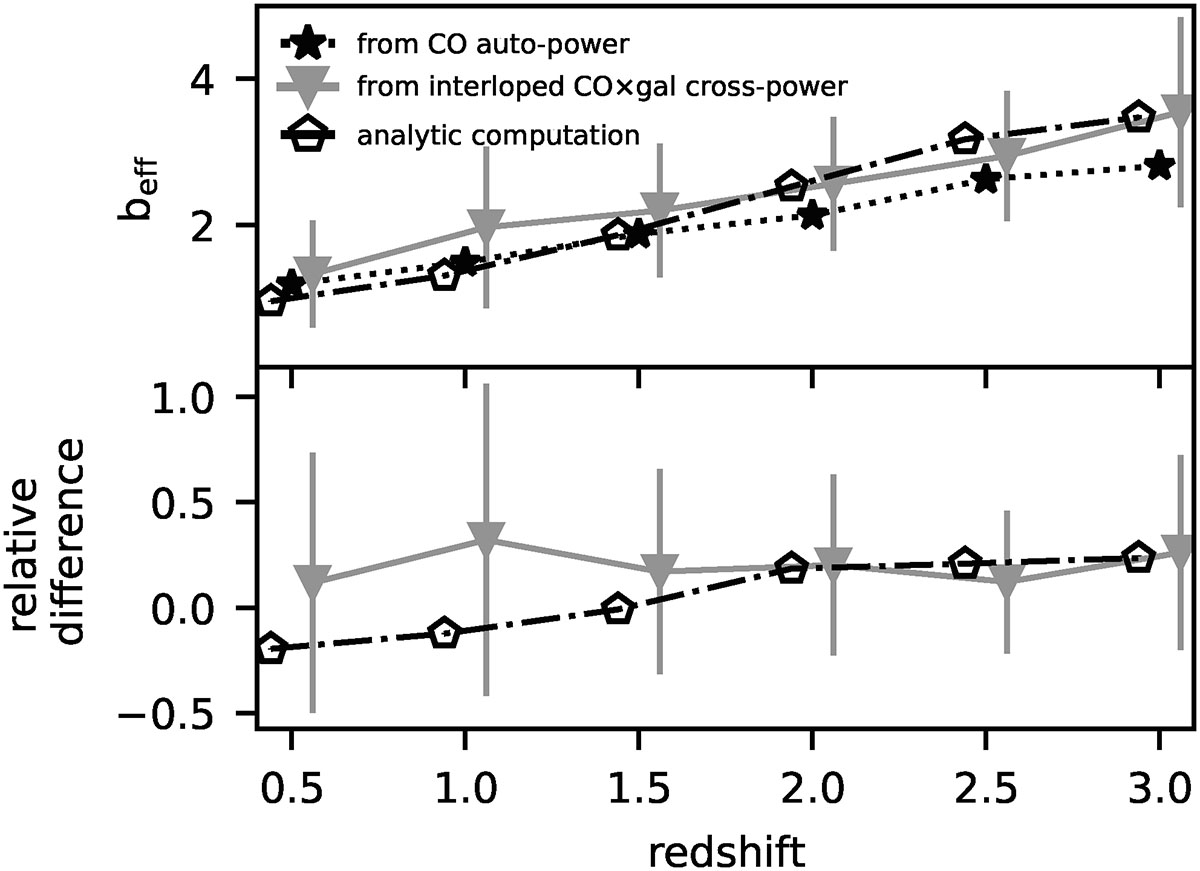
Fig. 7.
Download original image
Effective bias of CO-emitters as function of redshift. The points have been slightly shifted in the x-axis for clarity. In the upper panel, stars represent the values fit from the CO auto-power without contamination, as described in Sect. 3.4. Gray triangles are obtained from the fit of interloper-contaminated cross-power spectra between CO LIM and galaxies. Pentagons show the values obtained via the analytic computation using Eq. (17) and the halo bias model of Tinker et al. (2010). Values are reported in Table. A.1. Lower panel shows the relative difference with the auto-power-based values of the bias.
Current usage metrics show cumulative count of Article Views (full-text article views including HTML views, PDF and ePub downloads, according to the available data) and Abstracts Views on Vision4Press platform.
Data correspond to usage on the plateform after 2015. The current usage metrics is available 48-96 hours after online publication and is updated daily on week days.
Initial download of the metrics may take a while.