Fig. 5.
Download original image
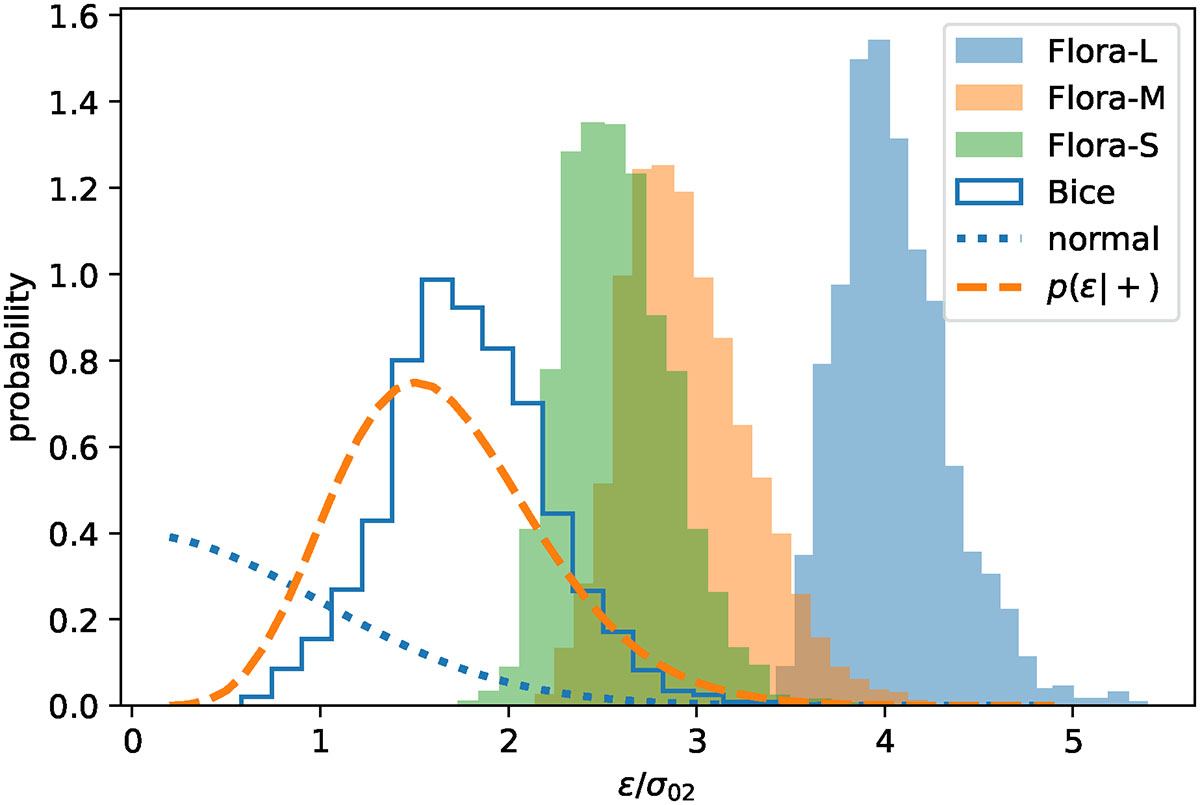
Distribution of trace ϵ/σ02 for a few ranges in halo mass (histograms). The dotted curve shows the expected (zero-mean, unit variance Gaussian) distribution at unconstrained positions; the dashed curve, at positions with λ3 ≥ 0 (Eq. 21). More massive haloes have larger ϵ/σ02, but the distribution around the mean is approximately independent of mass.
Current usage metrics show cumulative count of Article Views (full-text article views including HTML views, PDF and ePub downloads, according to the available data) and Abstracts Views on Vision4Press platform.
Data correspond to usage on the plateform after 2015. The current usage metrics is available 48-96 hours after online publication and is updated daily on week days.
Initial download of the metrics may take a while.