Open Access
Fig. 8.
Download original image
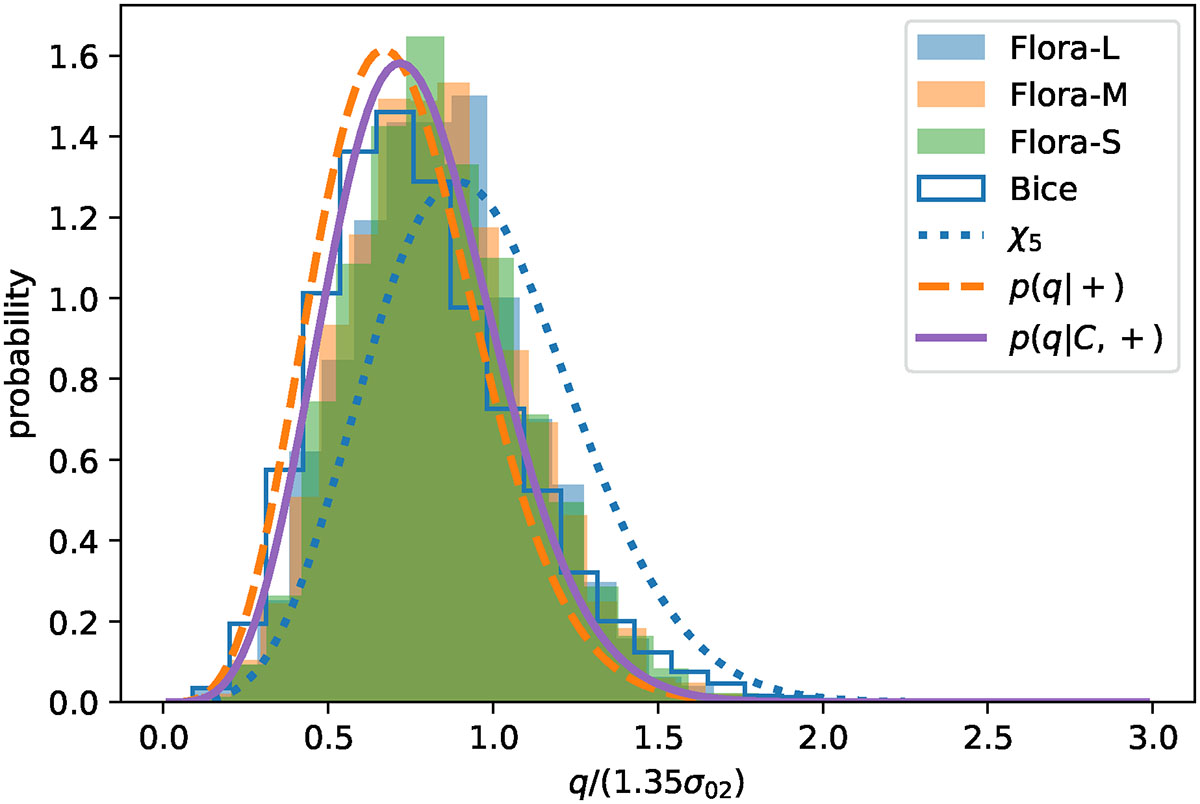
Distribution of q/(1.35σ02), the rescaling that provides the best match to equation (34) (purple solid line). Histograms show the measurements; dotted, dashed and solid curves show the distribution of random positions, those constrained to be positive definite, and those constrained to also have ϵ = b.
Current usage metrics show cumulative count of Article Views (full-text article views including HTML views, PDF and ePub downloads, according to the available data) and Abstracts Views on Vision4Press platform.
Data correspond to usage on the plateform after 2015. The current usage metrics is available 48-96 hours after online publication and is updated daily on week days.
Initial download of the metrics may take a while.