Open Access
Fig. A.3
Download original image
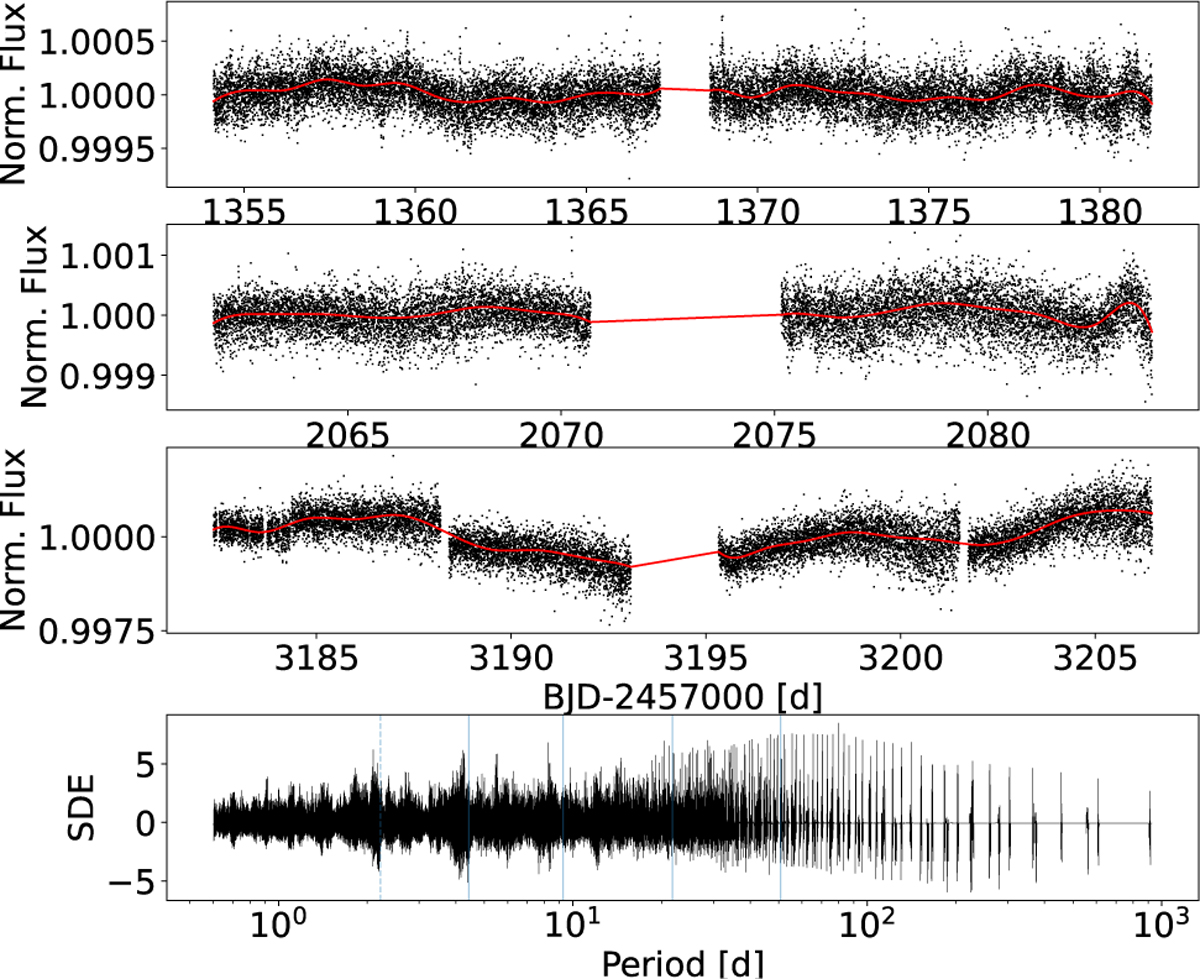
TESS PDCSAP light curves of GJ 887 of sectors 2, 28, and 69 in the top three panels with trends fitted as splines in red. In the lower panel a Transit Least Squares periodogram is shown along with vertical bars for the location of the planets (solid) and the candidate (dashed).
Current usage metrics show cumulative count of Article Views (full-text article views including HTML views, PDF and ePub downloads, according to the available data) and Abstracts Views on Vision4Press platform.
Data correspond to usage on the plateform after 2015. The current usage metrics is available 48-96 hours after online publication and is updated daily on week days.
Initial download of the metrics may take a while.