Fig. 2
Download original image
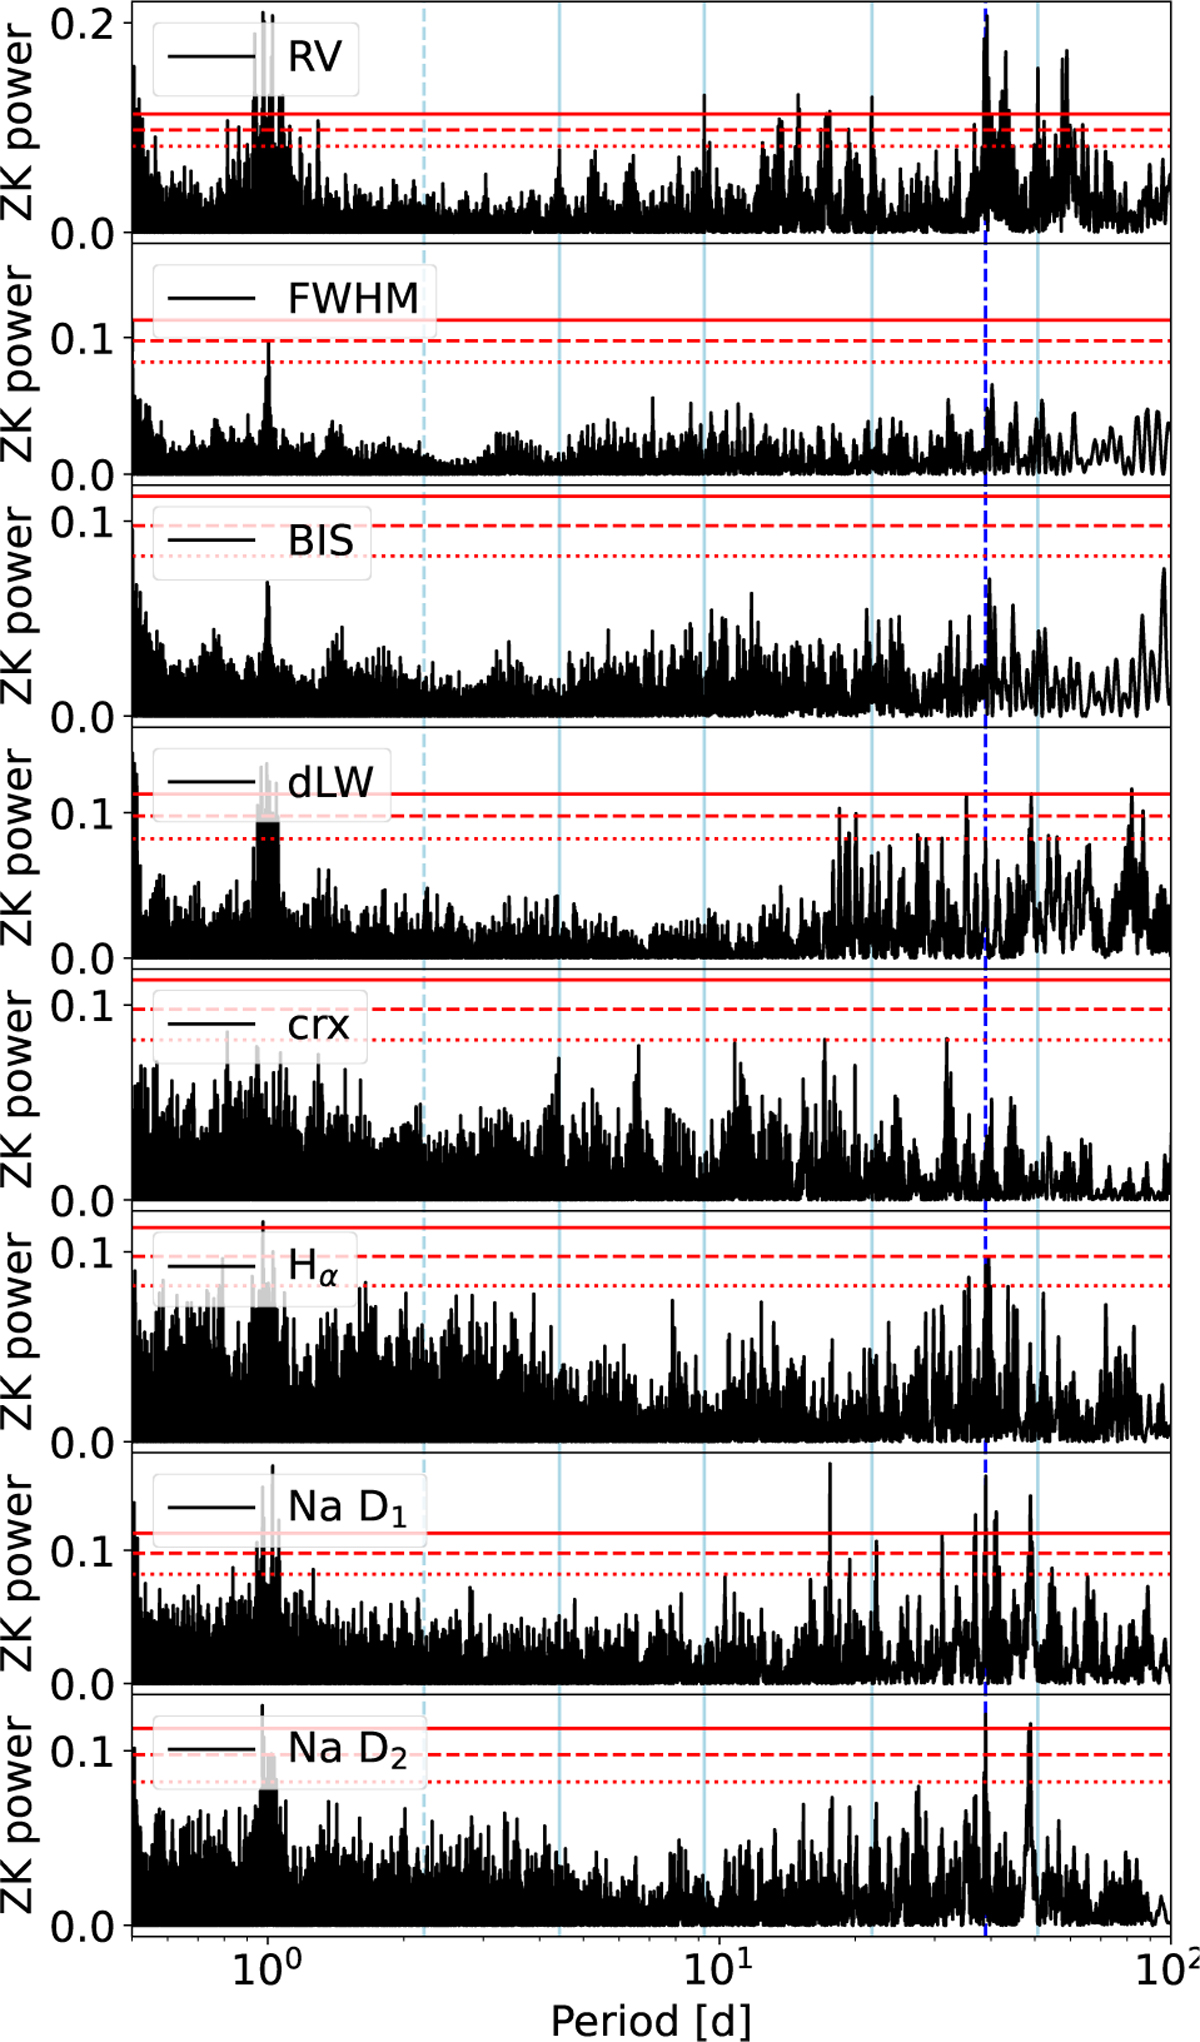
GLS periodograms of HARPS RV data and seven activity indicators described in the plots including 0.1, 0.01, and 0.001 FAP levels. The long-term trend was removed from all time series by subtracting the 600 d average from each observation. The blue line indicates the rotation period determined by photometry. The cyan lines represent signals that we attribute to planets (solid) and candidates (dashed).
Current usage metrics show cumulative count of Article Views (full-text article views including HTML views, PDF and ePub downloads, according to the available data) and Abstracts Views on Vision4Press platform.
Data correspond to usage on the plateform after 2015. The current usage metrics is available 48-96 hours after online publication and is updated daily on week days.
Initial download of the metrics may take a while.