Open Access
Fig. 3
Download original image
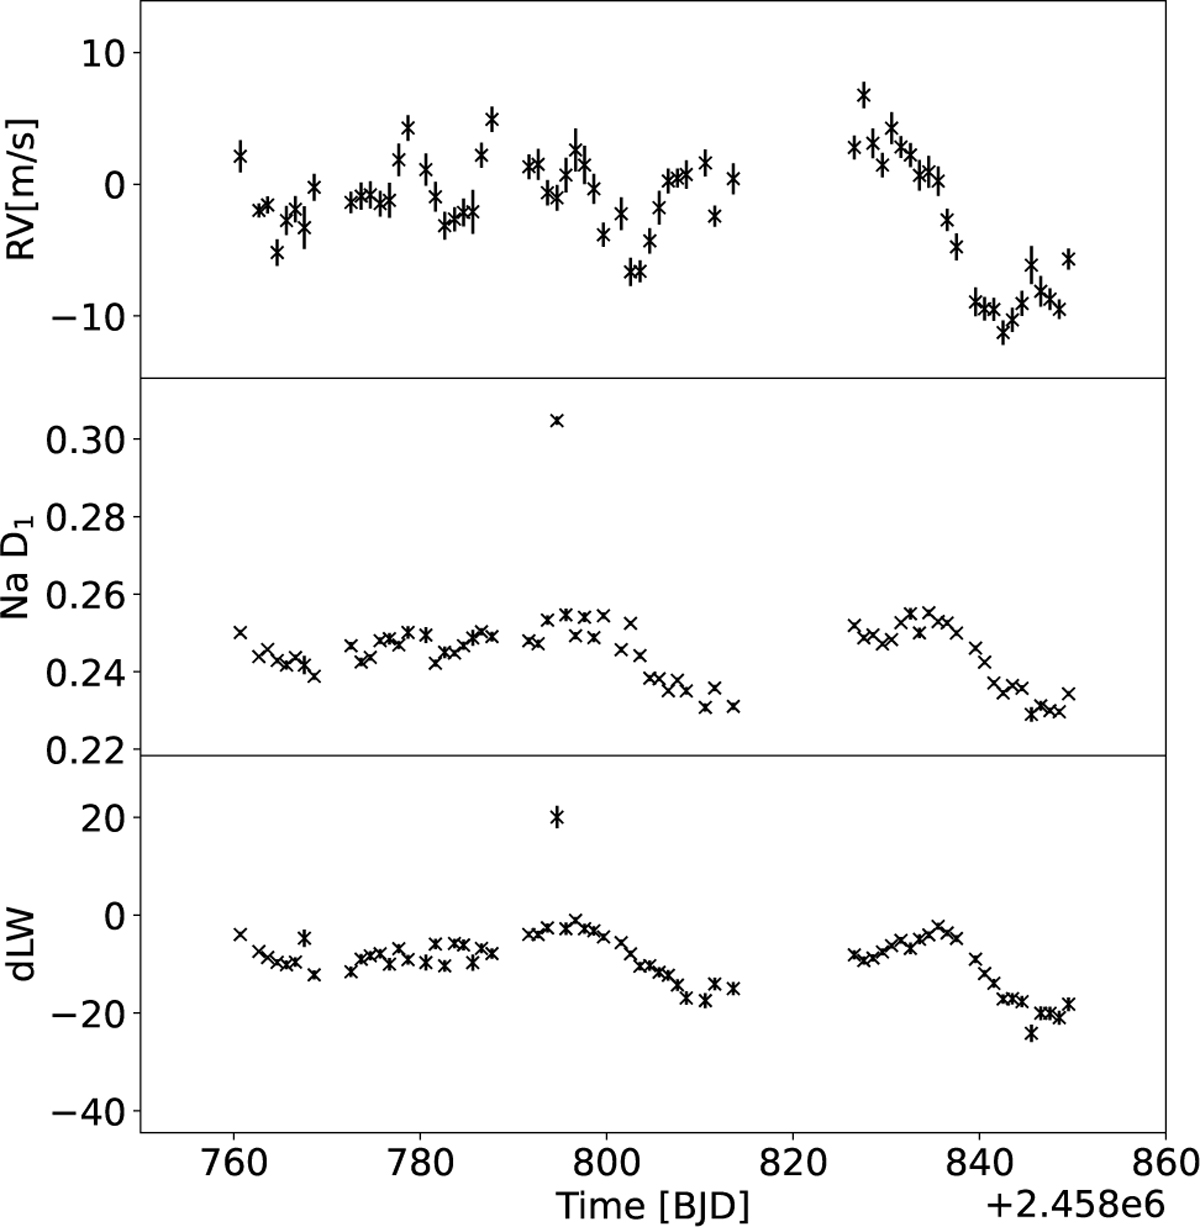
Time series of the active phase of GJ 887 in the RV and in Na D1 and dLW indicators. The spectra were recorded during the 2019 RedDots observing campaign.
Current usage metrics show cumulative count of Article Views (full-text article views including HTML views, PDF and ePub downloads, according to the available data) and Abstracts Views on Vision4Press platform.
Data correspond to usage on the plateform after 2015. The current usage metrics is available 48-96 hours after online publication and is updated daily on week days.
Initial download of the metrics may take a while.