Fig. 4
Download original image
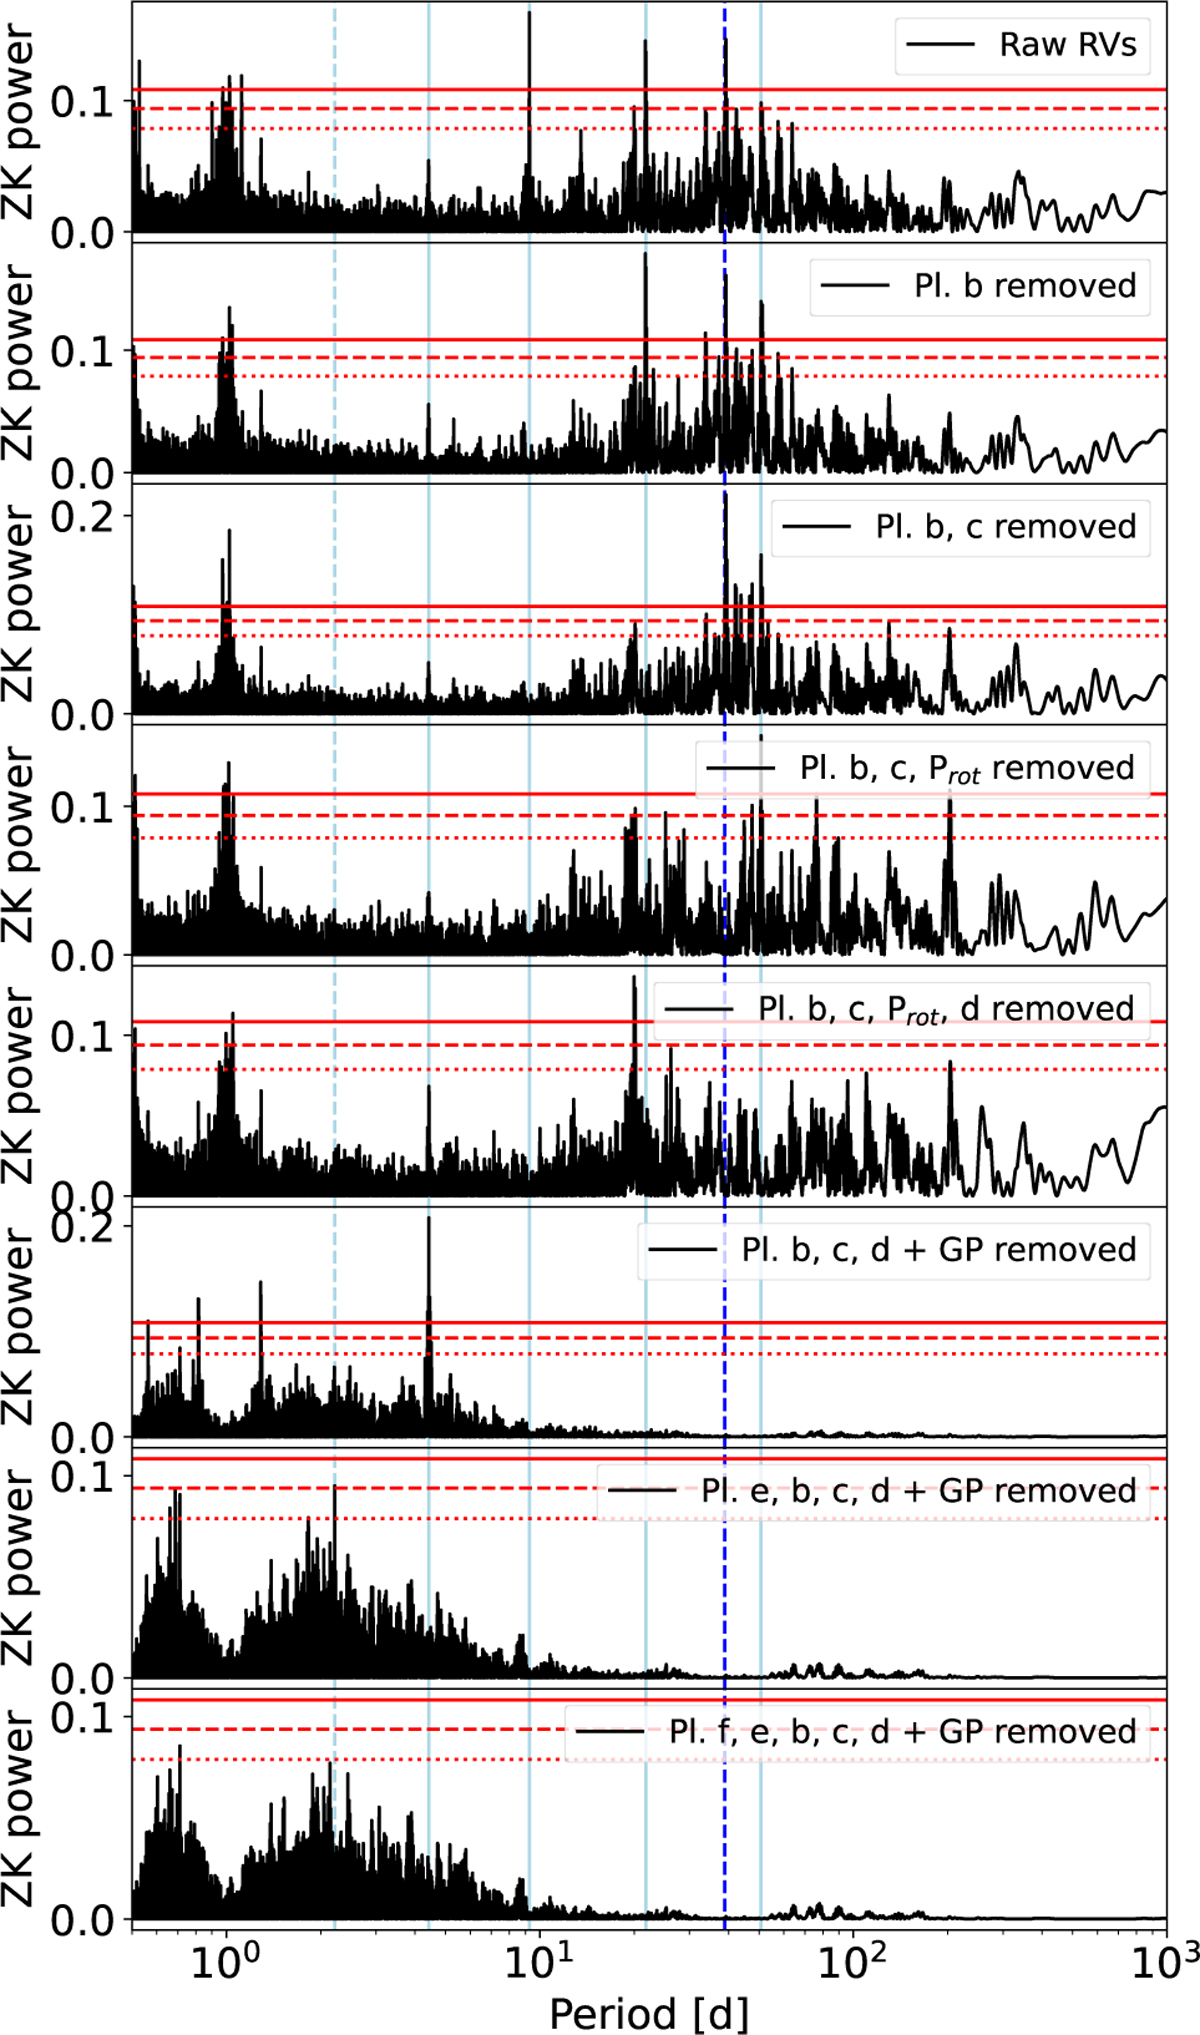
GLS periodogram of RVs 0.1, 0.01 and 0.001 FAP levels, shown in red. The blue line indicates the rotation period determined by photometry and spectroscopy. The cyan lines represent signals that we attribute to planets (solid) and candidates (dashed). The individual panels represent residuals of the respective model in the legend.
Current usage metrics show cumulative count of Article Views (full-text article views including HTML views, PDF and ePub downloads, according to the available data) and Abstracts Views on Vision4Press platform.
Data correspond to usage on the plateform after 2015. The current usage metrics is available 48-96 hours after online publication and is updated daily on week days.
Initial download of the metrics may take a while.