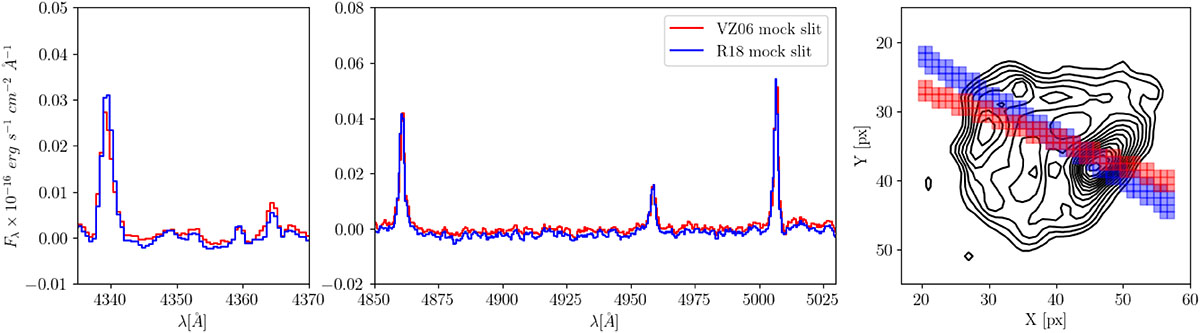
Fig. A.2.
Download original image
Integrated spectrum of the Leo A H II region using the VZ06 and R18 mock slits, with red and blue colours, respectively. Left panel: spectral window showing Hγ and [O III]λ4363 detection, from left to right, respectively. Middle panel: spectral window presenting the Hβ, and the [O III]λλ 4959,5007 detection, from left to right, respectively. Right panel: spatial distribution of pixels selected to reproduce both mock slits in the H II region. The grey contours represent the Hβ emission of the nebula for reference.
Current usage metrics show cumulative count of Article Views (full-text article views including HTML views, PDF and ePub downloads, according to the available data) and Abstracts Views on Vision4Press platform.
Data correspond to usage on the plateform after 2015. The current usage metrics is available 48-96 hours after online publication and is updated daily on week days.
Initial download of the metrics may take a while.