Open Access
Fig. E.3.
Download original image
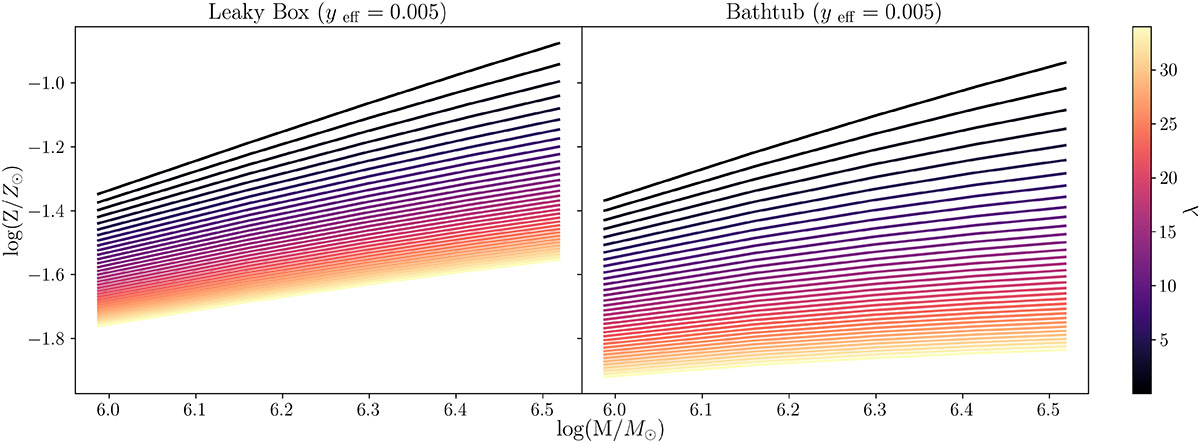
Comparison of evolutionary tracks between the leaky-box model (left panel) and the bathtub model (right panel) under yeff = 0.005. The colour code represents the mass loading factor (λ) evaluated from 0 to 35.
Current usage metrics show cumulative count of Article Views (full-text article views including HTML views, PDF and ePub downloads, according to the available data) and Abstracts Views on Vision4Press platform.
Data correspond to usage on the plateform after 2015. The current usage metrics is available 48-96 hours after online publication and is updated daily on week days.
Initial download of the metrics may take a while.