Fig. 4.
Download original image
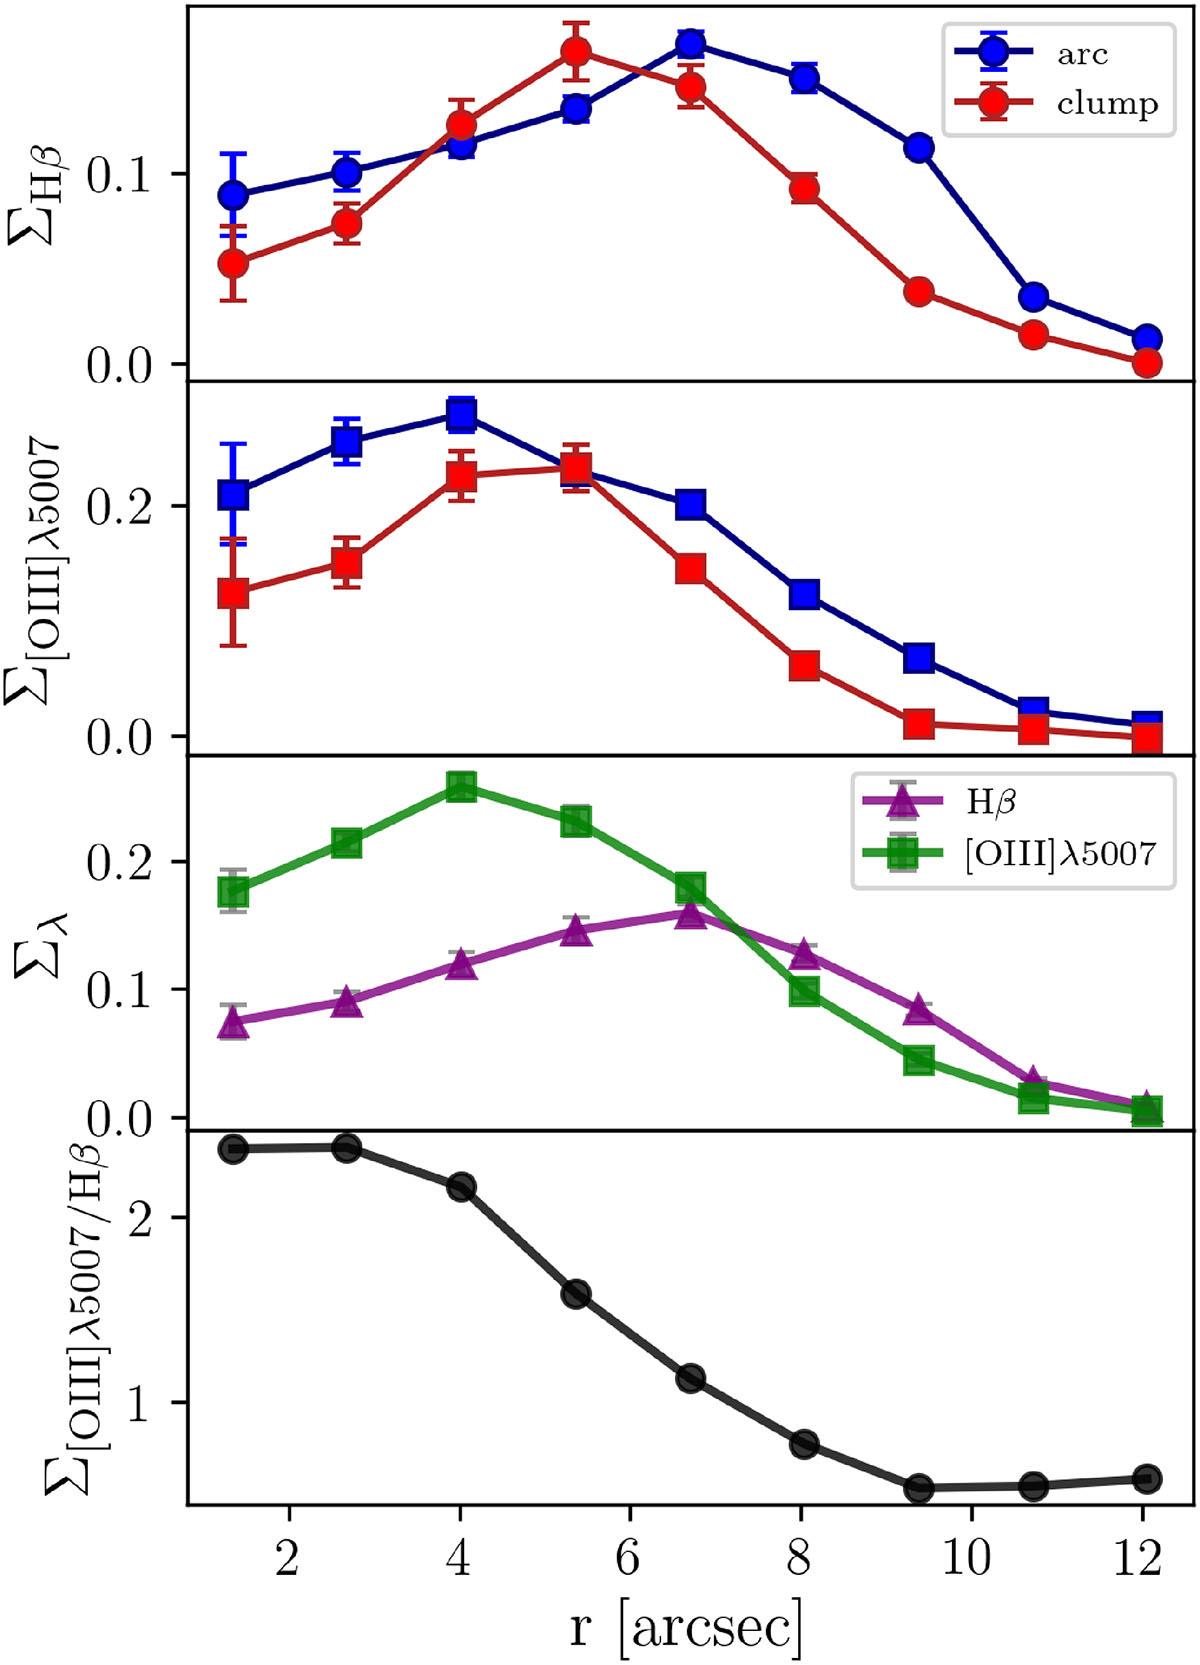
Flux-density profiles for the south-western clump and the extended arc in red and blue, respectively. The top panel shows the radial Hβ flux-density profiles for both structures. The upper middle panel shows the radial [O III]λ5007 flux-density profile for both structures. The bottom middle panel shows the Hβ and [O III]λ5007 flux-density profile in purple and green, respectively, for the complete nebula integrated over the entire angular range. The bottom panel shows the Hβ/[O III]λ5007 ratio in black for the complete nebula integrated over the entire angular range.
Current usage metrics show cumulative count of Article Views (full-text article views including HTML views, PDF and ePub downloads, according to the available data) and Abstracts Views on Vision4Press platform.
Data correspond to usage on the plateform after 2015. The current usage metrics is available 48-96 hours after online publication and is updated daily on week days.
Initial download of the metrics may take a while.