Fig. 5.
Download original image
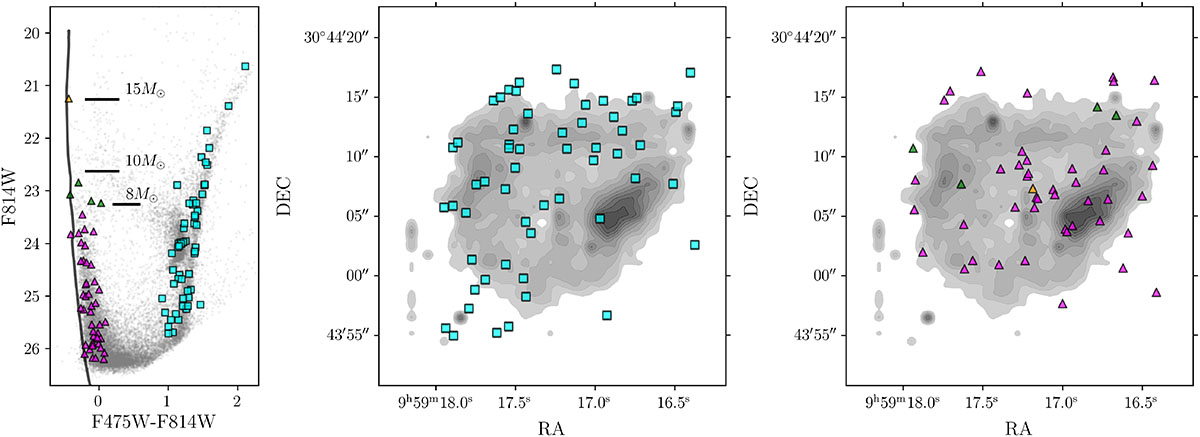
Comparison of Leo A H II region with Hβ emission (grey contours) with HST/ACS photometry. The left panel shows the location of young MS stars (magenta triangles) and old stars (cyan squares). A 10 Myr PARSEC isochrone is shown with the black curve in order to obtain a proxy of the stellar masses of the young stars. The middle panel shows the spatial distribution of old stars in the H II region, whereas the right panel shows the distribution of young MS stars in the H II region. The most massive star is shown with the orange triangle, and those with masses of 8 < M⊙ < 10 are shown with green triangles.
Current usage metrics show cumulative count of Article Views (full-text article views including HTML views, PDF and ePub downloads, according to the available data) and Abstracts Views on Vision4Press platform.
Data correspond to usage on the plateform after 2015. The current usage metrics is available 48-96 hours after online publication and is updated daily on week days.
Initial download of the metrics may take a while.